Fox Valley area of Illinois home prices June 21st
Fox Valley area of Illinois home prices June 21st. We are experiencing a heat advisory for the next few days. Please keep hydrated and cool. Right now it is 86 degrees with real feel 99 degrees. Highs for this next week will be between 86-96 degrees and lows between 69- 74 degrees.
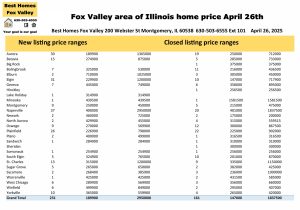
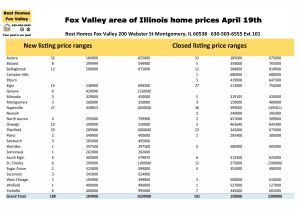
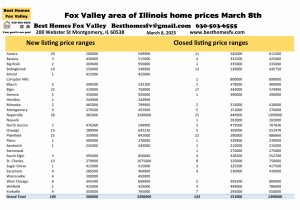
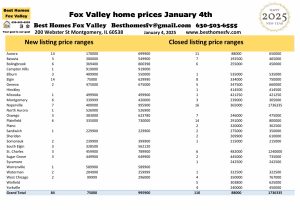
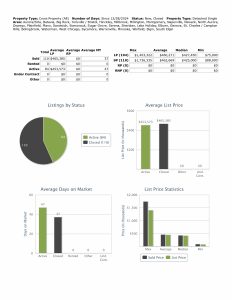
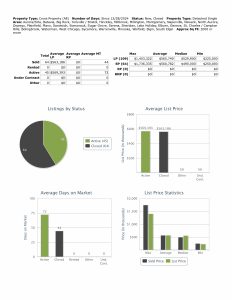
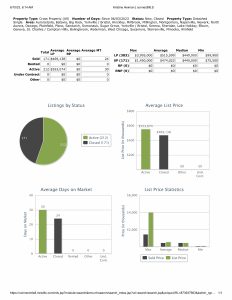
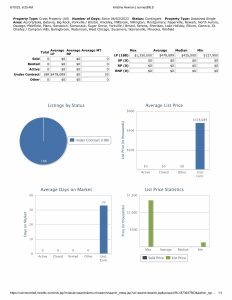
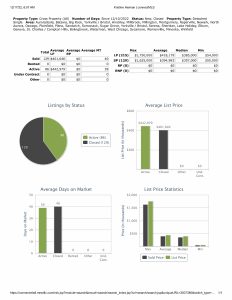
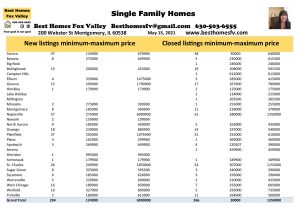
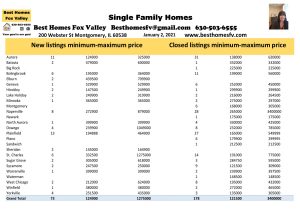
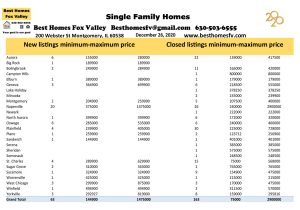
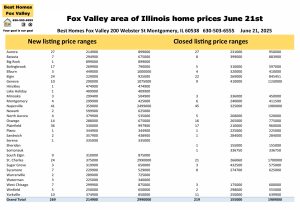
New listings this week are down. 269 this week compared to 284 the previous week.
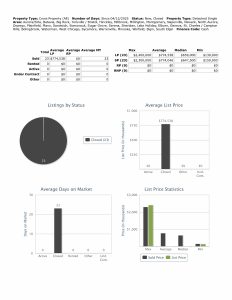
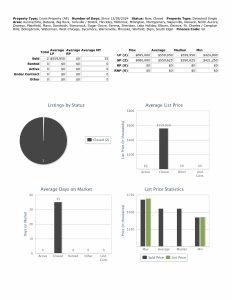
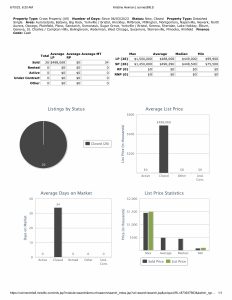
Closed listings are up. 219 this week compared to 196 the previous week.
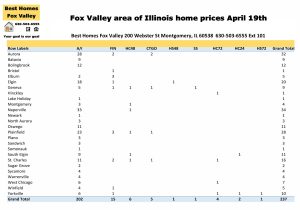
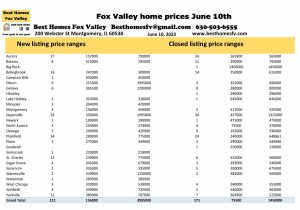
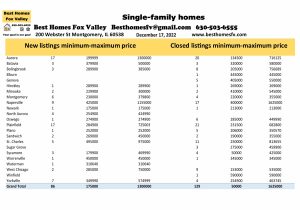
Aurora New-27 $214,900-$899,000
Closed-27 $231,000-$950,000
Bolingbrook New-17 $269,900-$790,000
Closed-5 $310,000-$597,000
Elgin New-24 $229,000-$925,000
Closed-22 $269,000-$845,451
Geneva New-10 $290,000-$1,075,000
Closed-9 $410,000-$1,150,000
Naperville New-41 $359,000-$2,499,000
Closed-45 $325,000-$1,989,000
Oswego New-14 $288,000-$675,000
Closed-16 $265,000-$775,000
Plainfield New-36 $330,000-$997,900
Closed-17 $210,000-$960,000
St Charles New-24 $375,000-$2,990,000
Closed-21 $266,060-$1,700,000
Yorkville New-10 $374,900-$850,000
Closed-11 $250,000-$639,900
See the photo above for other communities that also had activity this week and their price ranges.
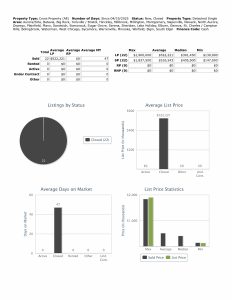
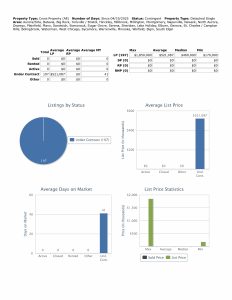
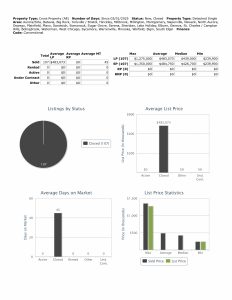
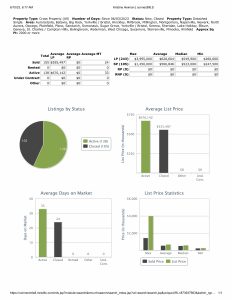
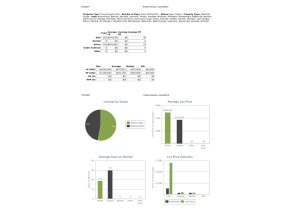
Financing used, median prices, and 2,000 SF or more
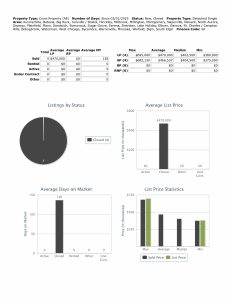
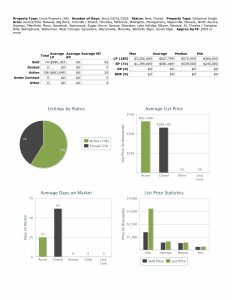
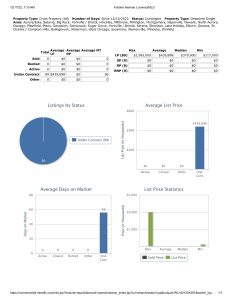
Median list price this week $489,900, last week $475,000.
Closed median price this week $475,000, last week $454,675.

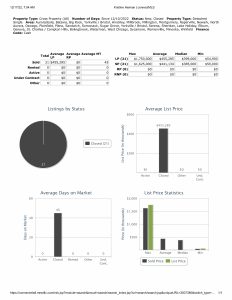
Conventional financing was used to close on 155 homes this week at median price $505,000 with 30 days average market time, last week 146 homes at median price $467,500 with 27 days average market time.

Cash was used to close on 32 homes this week at median price $532,292 with 30 days average market time, last week 26 homes at median price $442,000 with 94 days average market time.
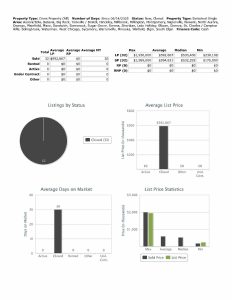
FHA financing was used to close on 23 homes this week at median price $360,000 with 33 days average market time, last week 12 homes at median price $357,500 with 53 days average market time.
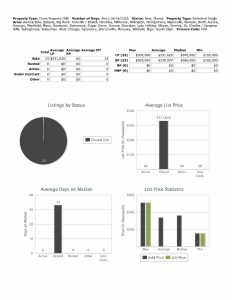
VA financing was used to close on 6 homes this week at median price $505,000 with 19 days average market time, last week 10 homes at median price $418,000 with 12 days average market time.

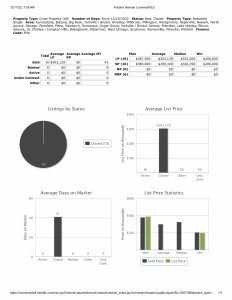
2,000 SF or more closed on 133 homes this week at median price $595,000 with 33 days average market time, last week 117 homes at median price $550,000 with 35 days average market time. Minimum price this week $305,000, last week $217,500.

Almost 71% used conventional financing to close this week. It has been since May 3rd that we have seen FHA in the 20’s used to close.
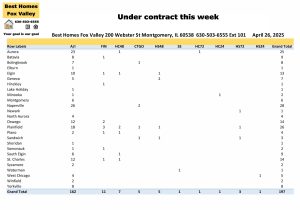
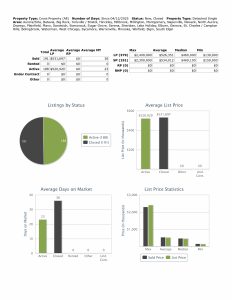
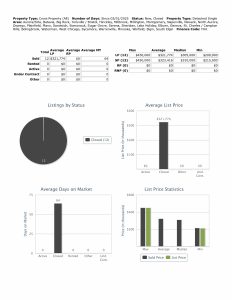
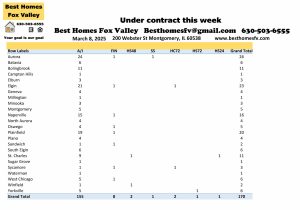
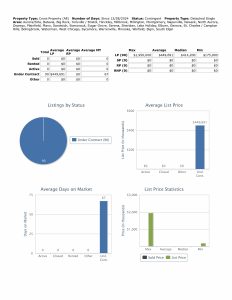
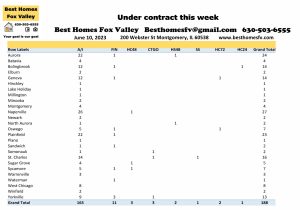
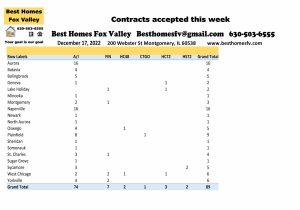
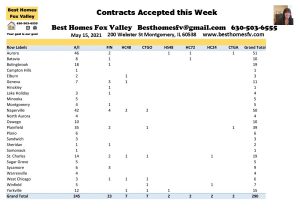
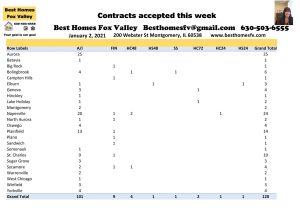
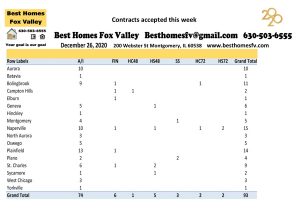
Under contract this week
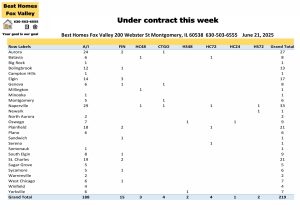
Aurora-27 Bolingbrook-13
Elgin-17 Naperville-33
Plainfield-21 St Charles-21
Other communities also had seller’s accepting contracts this week. Look at the photo above.
No short sales were accepted this week.
Seller’s accepted contracts that are contingent on the buyer closing on their current home. 4 with a kick-out clause of 72 hours, 3 with 48 hours, and 1 with 24 hours.
Also, seller’s accepted contracts that are contingent on the buyer selling and closing on their current home. 2 with a kick-out clause of 72 hours and 2 with 48 hours.
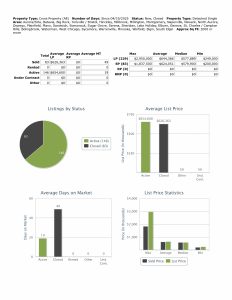
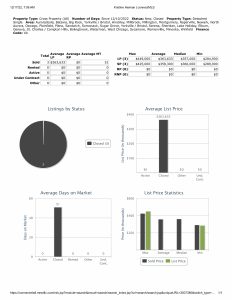
Median price of homes under contract this week $449,900 with 32 days average market time, last week $439,900 with 30 days average market time.

2025 by the month
Month New Closed Under contract
January 585 570 652
February 609 504 590
March 785 569 746
April 856 661 818
May 1282 961 1115
June 820 626 714
Totals 4937 3891 4635
Check back with us every Saturday for the real estate market update for the Fox Valley area of Illinois.
At the end of each month we will take a look back at 2024 and 2023 so you have something to compare to.
Contact us
Call us at 630503-6555 with all your real estate questions. Your goal is our goal.
If you are a buyer or seller looking for information about the process to buy or sell a home go to nar.realtor/the-facts. Please scroll down to the guides and videos there.
You can also request a home valuation, sign-up for email alerts, down payment assistance, and search for a home.
All data provided today was downloaded from our MLS, MRED, LLC. It changes throughout the day as agents upload their information.
Fox Valley area of Illinois home prices June 21st. Have an awesome week!
Kristine Heiman, Managing Broker
SFR, SRS, SRES, AHWD
200 Webster St
Montgomery, IL 60538
630-503-6555 Ext 101