Market update Fox Valley week 53
Market update Fox Valley week 53. Yes week 53. When a leap year and the first day of the year is a Wednesday we have 53 weeks in the year according to timeanddate.com. Most of the business days this week were in 2020.
New listings of single family homes were up this week. 73 this week compared to 63 the week before. Not too bad for in between 2 holidays.
Closed listings this week of single family homes were also slightly up. 178 this week compared to 163 the week before.
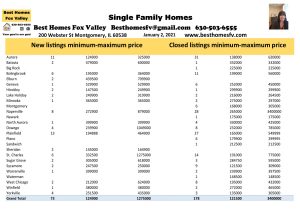
Take a look at the communities with the most activity this week:
Aurora-New 11 $124,900-$325,000
Closed-31 $138,000-$620,000
Bolingbrook-New 6 $195,000-$364,000
Closed-11 $199,000-$560,000
Naperville-New 8 $272,900-$879,000
Closed-28 $265,000-$3,400,000
Plainfield-New 13 $194,888-$464,900
Closed-27 $165,000-$549,999
St Charles/Campton Hills-
New 6 $332,500-$1,275,000
Closed-14 $191,000-$775,000
These are the communities that perform higher than most week after week throughout the year.
Contracts accepted this week
We saw a very nice increase in contracts accepted this week by sellers. 120 this week compared to 93 the week before.
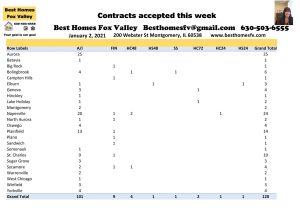
Buyers did not sit on the sidelines between the holidays. 2021 is expected to be more of the same as 2020. We are hoping for more inventory so buyers have more to choose from.
Look at the communities sellers accepted the most contracts this week:
Aurora-25 Naperville-24
Plainfield-14 St Charles/Campton Hills-10
1 short sale was accepted by a seller this week. It was in Bolingbrook. Now it will be submitted to the lender to see if they will also accept.
Sellers accepted contracts that are contingent on the buyer closing on their current home. 2 with a kick-out clause of 72 hours, 4 with 48 hours and 1 with 24 hours.
Also, sellers accepted contracts that are contingent on the buyers selling and closing on their current home. 1 with a kick-out clause of 48 hours and 1 with 24 hours.
2020 by the month and a look back at 2019 and 2018
2020
Month New Closed Contracts accepted
January 1105 566 858
February 1267 529 1024
March 1186 707 1079
April 648 786 775
May 1352 1010 1444
June 1232 908 1534
July 1417 1453 1852
August 1037 1335 1436
September 1176 1503 1503
October 843 1116 1159
November 567 985 699
December 513 971 783
Totals 12343 11869 14146
2019
January 878 407 568
February 1032 463 832
March 1731 915 1375
April 1594 792 1307
May 1645 995 1280
June 1643 1253 1218
July 1423 1008 1090
August 1585 1330 1196
September 1164 765 869
October 1041 738 776
November 897 946 839
December 496 638 497
Totals 15129 10250 11847
2018
January 808 489 606
February 1040 444 856
March 1549 907 1564
April 1515 836 1278
May 1569 1066 1344
June 1828 1720 1474
July 1318 994 1061
August 1294 1032 989
September 1479 1093 1078
October 1042 712 748
November 729 739 653
December 665 762 602
Totals 14836 10794 12253
Of the 3 years 2020 was the best for closed listings of single family homes. Closed listings is the most important column to look at because these are actual numbers.
New listing and contracts accepted both can end up listed more than once. Sometimes agents after a couple months add them as a new listing again. Lately not too many properties stay on the market that long though. Listings of homes that seller accepts a contract sometimes do not make it past the home inspection and attorney review period.
Even though new listings might of been counted more than once, 2020 had the least amount of new listings with the most closed homes. That is why prices are rising the way they are. Inventory is severely low.
2020 also saw the most contracts accepted. Buyers are ready to go. They are not afraid to write the offer. They know they are up against multiple offers so they are writing their best offer right away.
The lowest month for closed listing in 2020 was 529 in February and it was higher than the lowest month in the previous 2 years.
2018 saw the highest amount of closed listings in June and it was highest of the 3 years. August was the highest amount of closed in 2019 but it was below the highest month of 2020 that was in September. Most years you see the highest amount during the summer months and before school starts. This year with e-learning you can see that the market was extended until October
Contact us
Call us at 630-503-6555 with all your real estate questions. Your goal is our goal. We will do everything we can to help you reach your goal.
Thinking about selling in 2021? Request a home valuation so we can let you know what your home is worth in today’s market. We will provide you with a net proceeds that shows you an estimate of expenses to sell your home. This will be updated when an offer comes in and we know all the terms so you can make a good decision.
If you are wanting to buy a home in 2021 you need to get some items together and contact a loan officer. They will want a couple of years of tax returns, pay stubs, bank statements, credit card information, car payments and any other monthly payments you have. Once they go over your credit information they will give you a letter that shows you what type of loan will work out best for you and what price. This letter will go with an offer when you find a home. It needs to be updated if it is older than 30 days.
Check out some great resources that might help you:
- Types of loans and the process
- VA loans and the requirements
- Current interest rates
- Down payment assistance
- Illinois homeowner assistance and some community assistance
- IDHA programs
If you are looking for any other information let us know and we will point you in the right direction. We can make recommendations for loan officers, real estate attorneys and home inspectors we have successfully worked with in the past.
Market update Fox Valley week 53. Happy New Year! Have a great week.
 Kristine Heiman, Designated Managing Broker
Best Homes Fox Valley-Search for a home today!
200 Webster St
Montgomery, IL 60538
630-503-6555 ext 101