Fox Valley area of Illinois home prices January 17th
Fox Valley area of Illinois home prices January 17th. Right now it is 17 degrees and partly cloudy. This next week we should see highs from 7-30 degrees and lows from -1-20 degrees. It looks like it is going to be like this for the rest of this month.
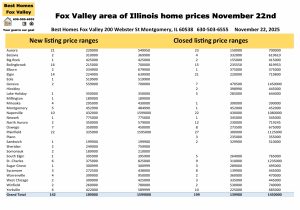
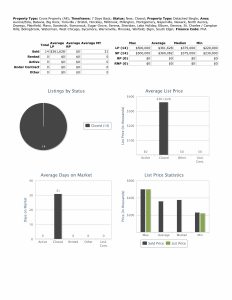
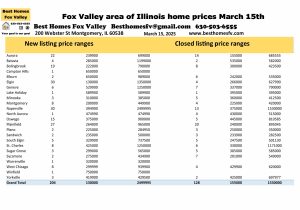
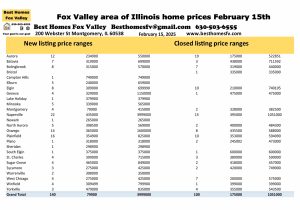
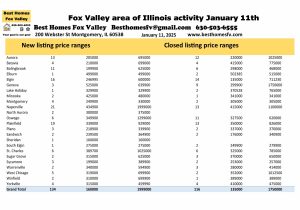
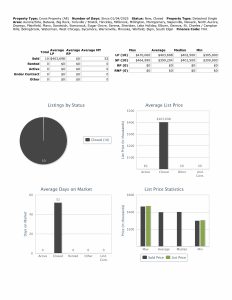
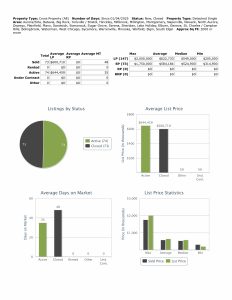
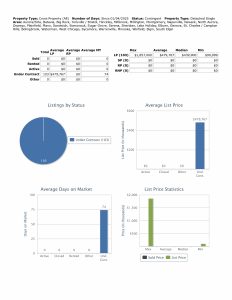
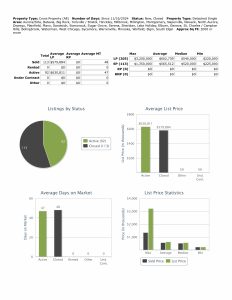
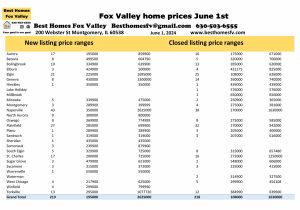
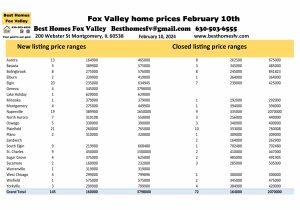
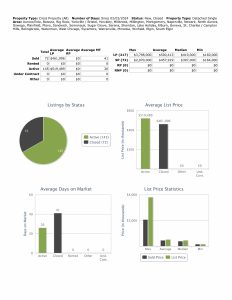
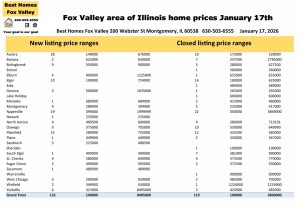
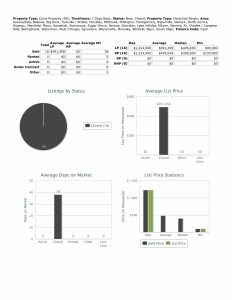
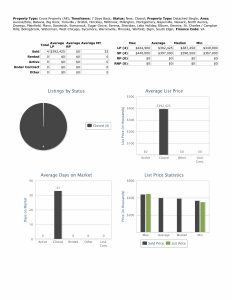
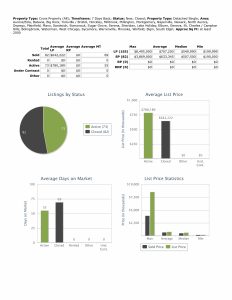
132 new listings this week and 119 closed listings.
Aurora New-28 $140,000-$676,000
Closed-10 $175,000-$528,990
Elgin New-10 $199,900-$724,900
Closed-14 $100,000-$625,000
Naperville New-19 $399,000-$1,999,999
Closed-22 $350,000-$3,869,000
Oswego New-9 $375,000-$705,000
Closed-10 $350,000-$649,990
Plainfield New-15 $289,900-$725,000
Closed-12 $325,500-$585,000
Look at photo above to see other communities that also had activity this week and their price ranges.
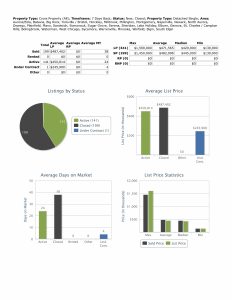
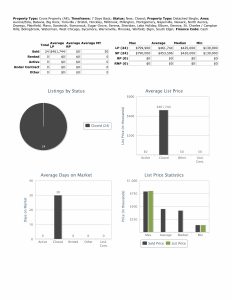
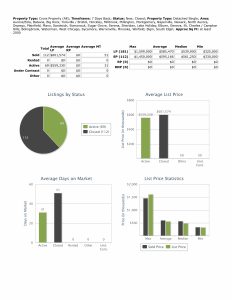
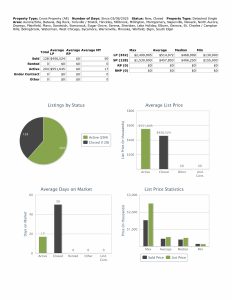
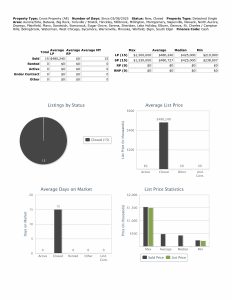
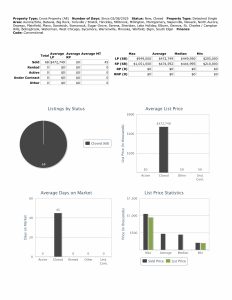
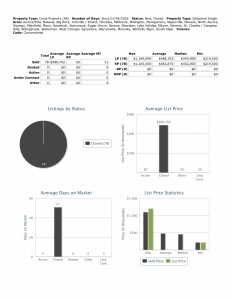
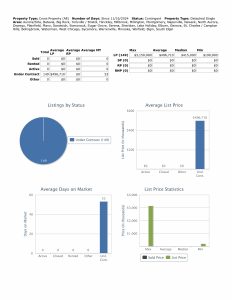
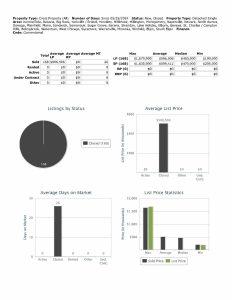
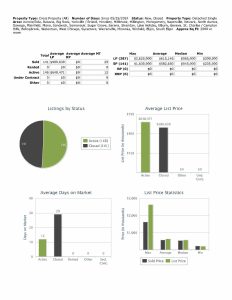
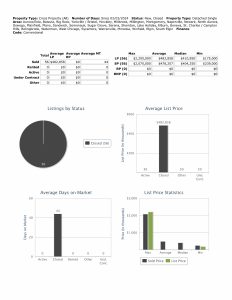
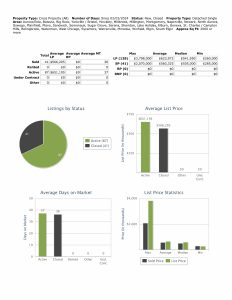
Financing used, median prices, and 2,000 SF or more
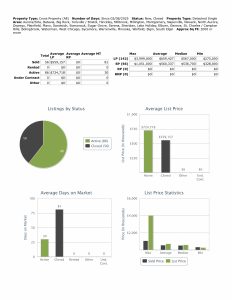
Median list price this week $469,900.
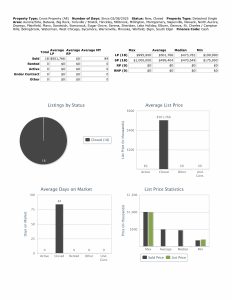
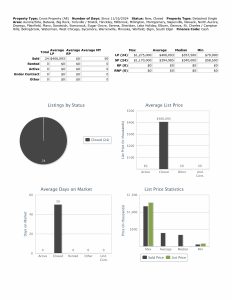
Closed median price this week $445,000.
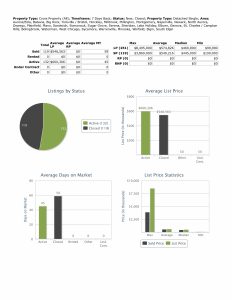
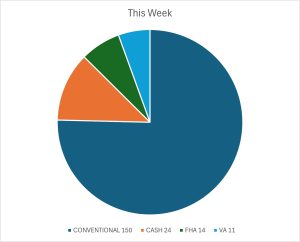
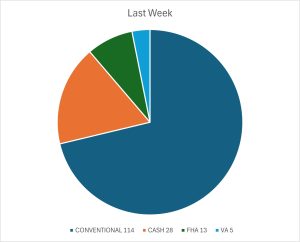
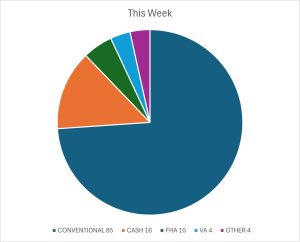
Conventional financing was used to close on 85 homes this week at median price $465,000 with 64 days average market time.
Cash was used to close on 16 homes this week at median price $399,200 with 38 days average market time.
FHA financing was used to close on 10 homes this week at median price $391,200 with 36 days average market time.

VA financing was used to close on 4 homes this week at median price $390,500 with 33 days average market time.
2,000 SF or more closed on 82 homes this week at median price $507,500 with 55 days average market time. Minimum price this week $190,000.
Over 71% of homes closed this week using conventional financing and over 68% of homes closed were at least 2,000 SF or more.
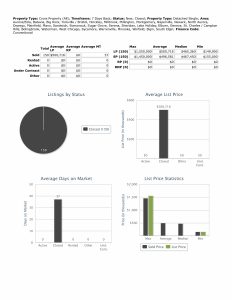
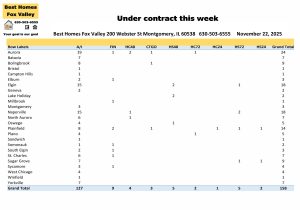
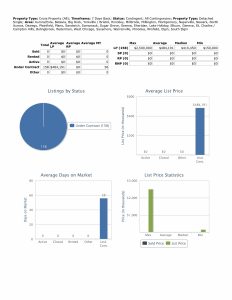
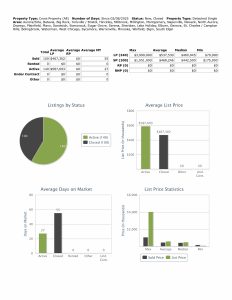
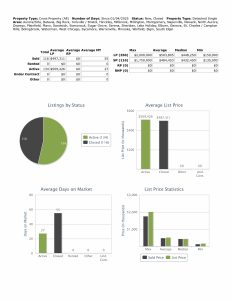
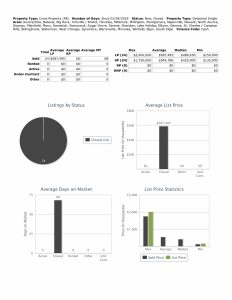
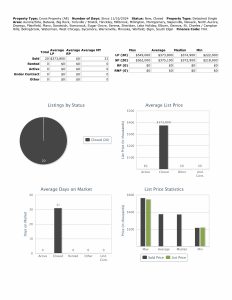
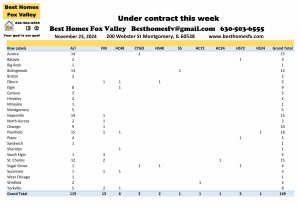
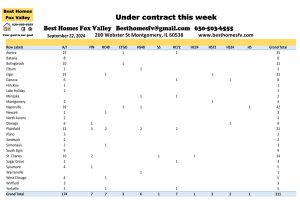
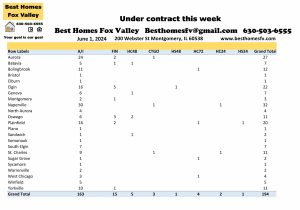
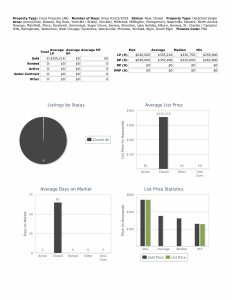
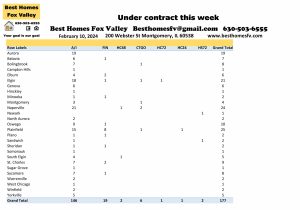
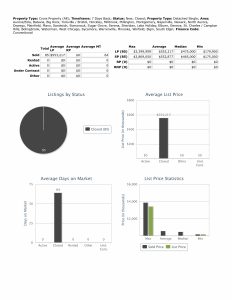
Under contract this week
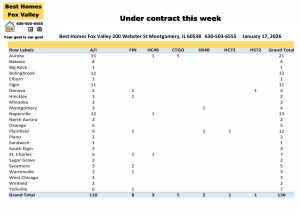
130 homes went under contract this week.
Aurora-21 Bolingbrook-12
Elgin-11 Naperville-13
Plainfield-12
No short sales were accepted by seller’s this week.
Seller’s accepted contracts that are contingent on the buyer closing on their current home. 1 with a kick-out clause of 72 hours and 3 with 48 hours.
Also, seller’s accepted contracts that are contingent on the buyer selling and closing on their current home. 1 with a kick-out clause of 72 hours and 2 with 48 hours.
Under contract median price this week $417,500 with 75 days average market time.

Now that the holidays are over maybe the days on market stats will start to come down.
Contact us and information to check out
Call us at 630-503-6555 with all your real estate questions. Your goal is our goal.
To find out information about the buying and selling process you can go to nar.realtor/the-facts and scroll down to see the guides and videos. If you still have questions please contact us and we will answer your questions.
You can also go torequest a home valuation, sign-up for email alerts, down payment assistance, IHDA programs, andsearch for a home.
All data provided today was downloaded from our MLS, MRED, LLC. It changes throughout the day as homes come on the market or change status
Fox Valley area of Illinois home prices January 17th. Have an awesome week!
Kristine Heiman, Managing Broker
ABR, AHWD, MRP, SFR, SRES, SRS
200 Webster St
Montgomery, IL 60538
630-503-6555 Ext 101