Fox Valley home prices April 22nd

Fox Valley home prices April 22nd. We have a freeze warning tonight and we have had quite a few bad storms lately. Next week it should be in the 50 and 60’s. Hopefully the temps will even out soon.
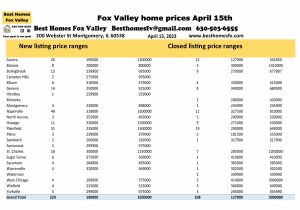
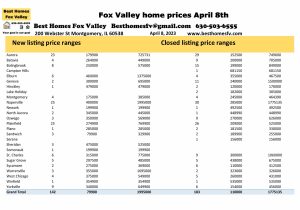
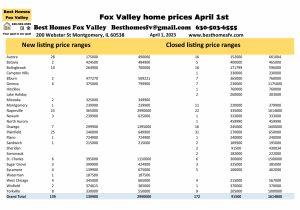
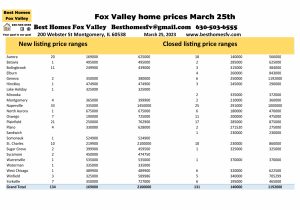
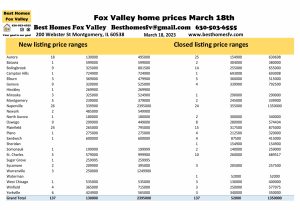
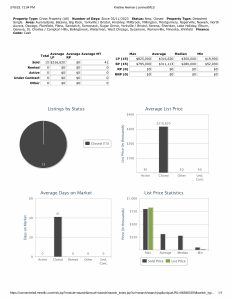
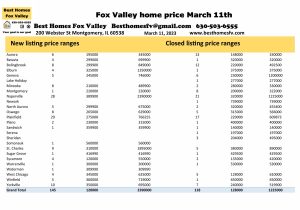
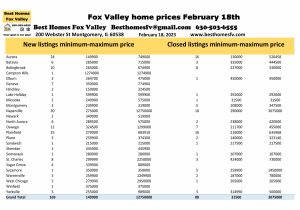
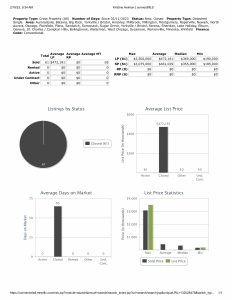
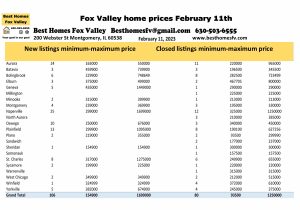
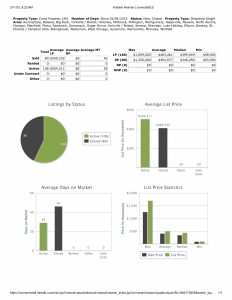
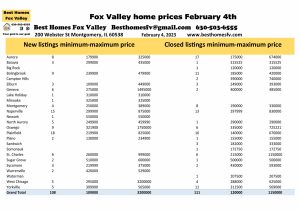
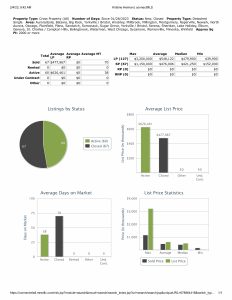
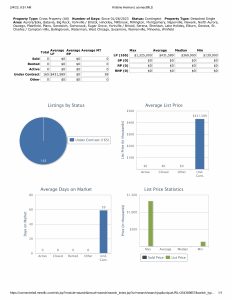
New listings this week are down. 183 this week compared to 220 the previous week.
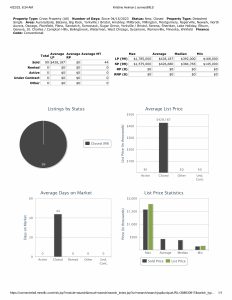
Closed listings are up. 132 this week compared to 108 the previous week.
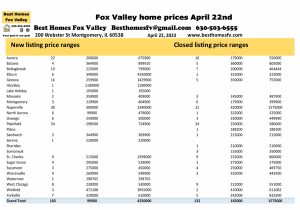
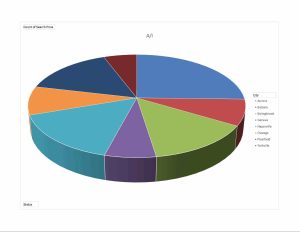
Aurora-New 22 $200,000-$675,900
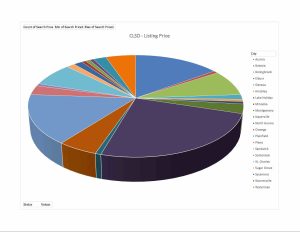
Closed-16 $179,000-$550,000
Bolingbrook-New 19 $225,000-$799,000
Closed-7 $200,000-$464,444
Geneva-New 16 $259,900-$1,429,900
Closed-5 $350,000-$755,000
Naperville-New 30 $300,000-$2,340,000
Closed-22 $320,000-1,575,000
Plainfield-New 24 $298,500-$724,900
Closed-24 $250,000-$580,000
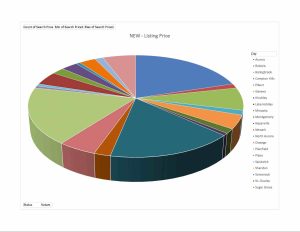
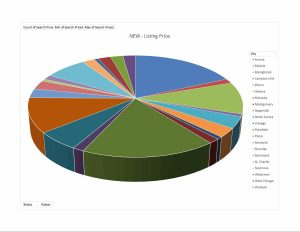
Click on the photo above to see other communities that had activity this week. We just highlighted the ones with the most activity.
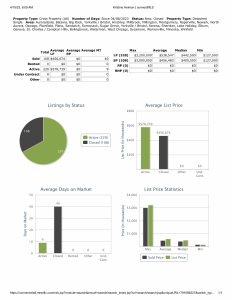
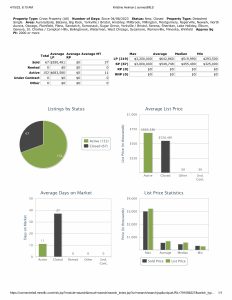
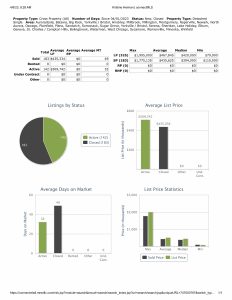
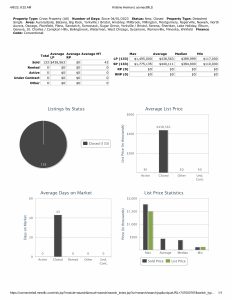
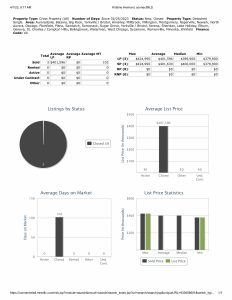
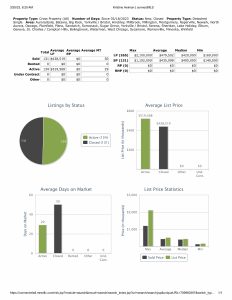
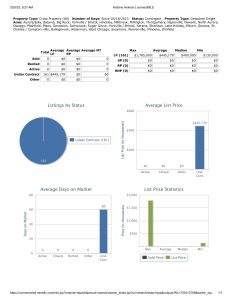
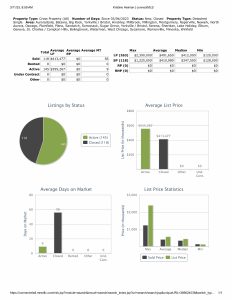
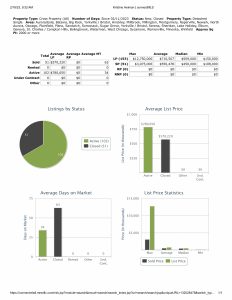
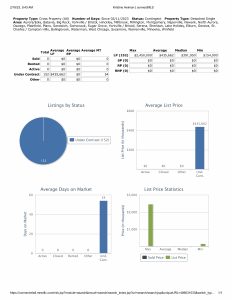
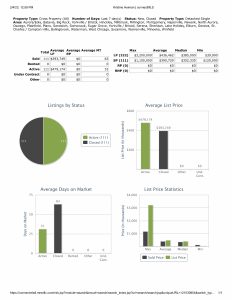
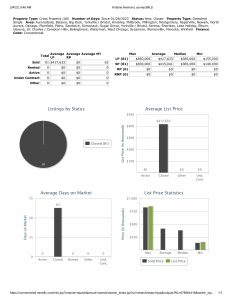
Financing used, median price, and 2,000 SF or more
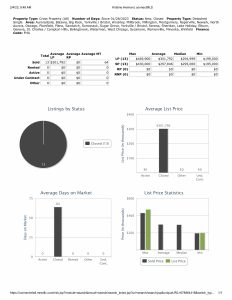
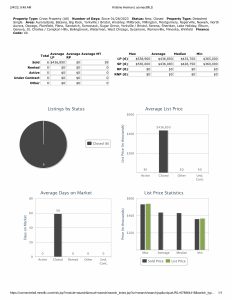
Median list price this week $399,000, last week $442,500.
Closed median price this week $372,500, last week $400,500.

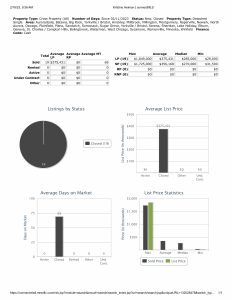
Conventional financing was used to close on 99 homes at median price $384,765 with 44 days average market time, last week 83 homes at median price $410,000 with 45 days average market time.
Cash was used to close on 16 homes this week at median price $390,000 with 58 days average market time, last week 14 homes at median price $337,500 with 14 days average market time.

FHA financing used to close on 10 homes at median price $226,000 with 58 days average market time, last week 8 homes at median price $344,950 with 42 days average market time.

VA financing used to close on 5 homes this week at median price $410,000 with 76 days average market time, last week 4 homes at median price $404,820 with 21 days average market time.
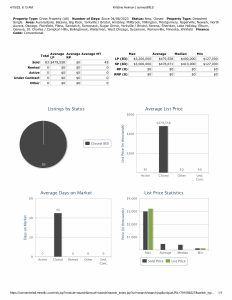
2,000 square feet or more closed on 65 homes at median price $470,000 with 62 days average market time, last week 67 homes at median price $455,490 with 37 days average market time. Minimum price this week $200,000, last week $325,000.

75% of homes closed this week used Conventional financing.
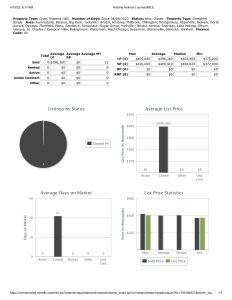
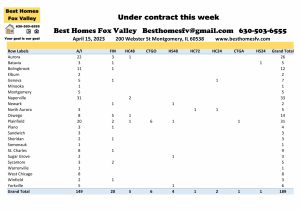
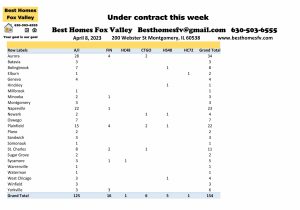
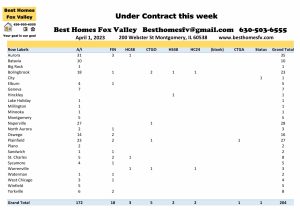
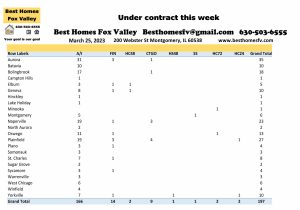
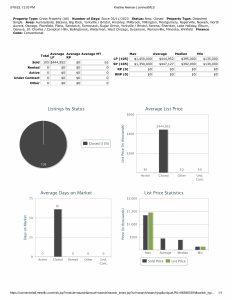
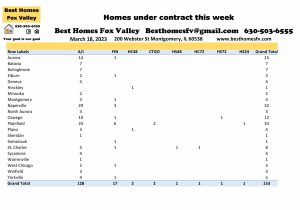
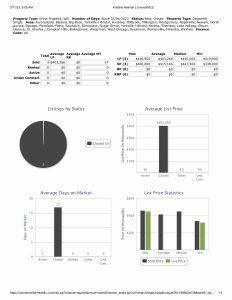
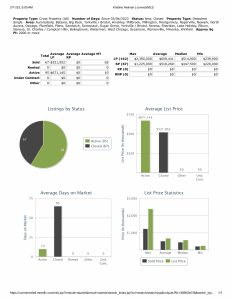
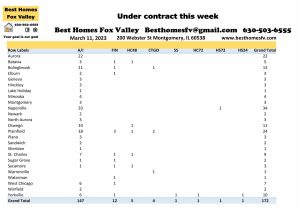
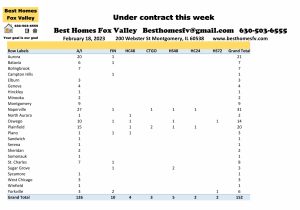
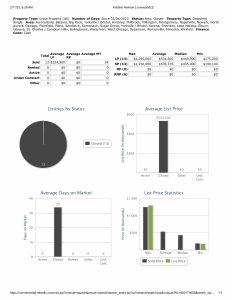
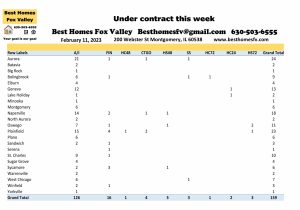
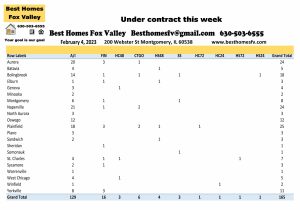
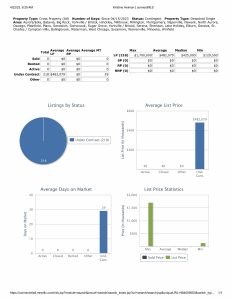
Under contract this week
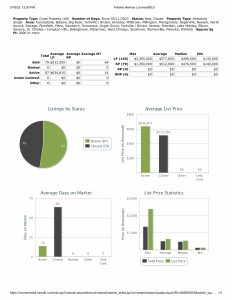
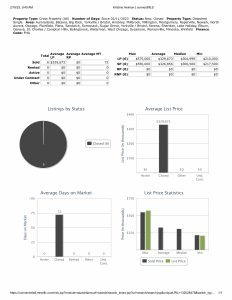
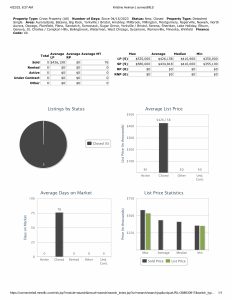
Under contract this week are up. 218 this week compared to 189 the previous week.
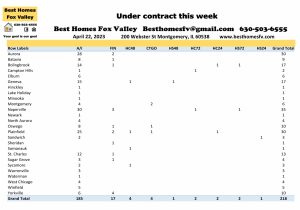
Aurora-30 Bolingbrook-17
Geneva-17 Naperville-35
Oswego-10 Plainfield-30
St Charles-13 Yorkville-10
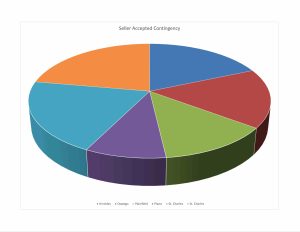
No short sales were accepted by seller’s this week.
Seller’s accepted contracts that are contingent on the buyer closing on their current home. 2 with a kick-out clause of 72 hours, 4 with 48 hours, and 2 with 24 hours.
Also, seller’s accepted contracts that are contingent on the buyer selling and closing on their current home. 2 with a kick-out clause of 72 hours, 1 with 48 hours, and 1 with 24 hours.
Under contract median price this week $425,000 with 29 days average market time, last week median price $415,000 with 33 days average market time.
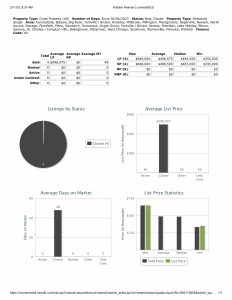
2023 by the month
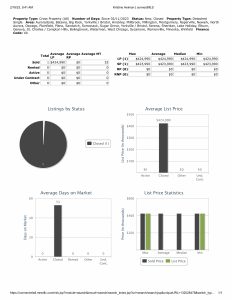
Month New Closed Under Contract
January 483 326 470
February 630 526 789
March 555 558 726
April 545 423 561
Totals 2213 1833 2546
Check back with us every Saturday for the real estate market update for the Fox Valley area of Illinois. At the end of each month we will also take a look back at 2022 and 2021 so you have something to compare it to.
Resources
Click on each bullet point to take you to the site for the information.
- Types of loans and the process
- VA loans and the requirements
- Down payment assistance
- IHDA programs
- Request a home valuation
- Sign-up for email alerts
- Search for a home
All data is from our MLS, MRED, LLC. It changes throughout the day.
Contact us
Call us at 630-503-6555 with all your real estate questions. Your goal is our goal.
Fox Valley home prices April 22nd. Have an awesome week!
Kristine Heiman, Designated Managing Broker
SFR, SRS, SRES, AHWD
Best Homes Fox Valley
200 Webster St
Montgomery, IL 60538
630-503-6555 Ext 101