Fox Valley home prices February 3rd
Fox Valley home prices February 3rd. Temperatures this next week are going to be so nice! Upper 40’s to mid 50’s.
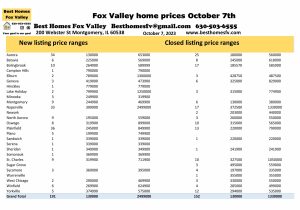
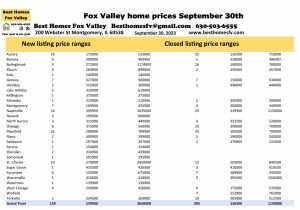
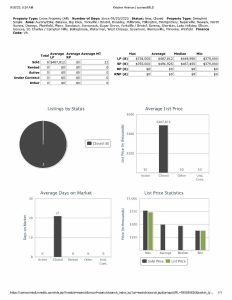
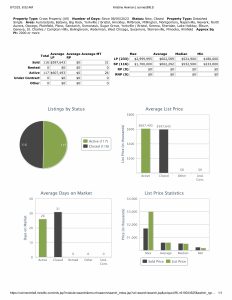
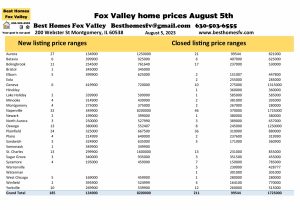
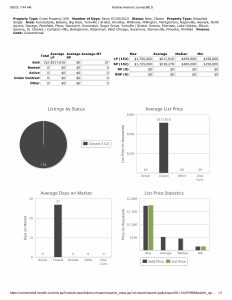
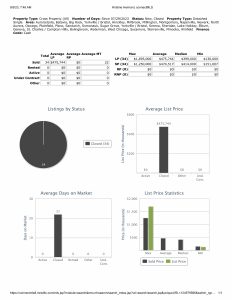
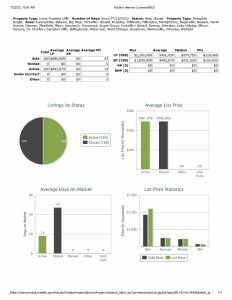
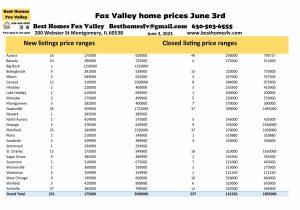
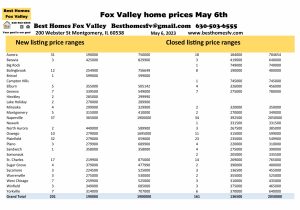
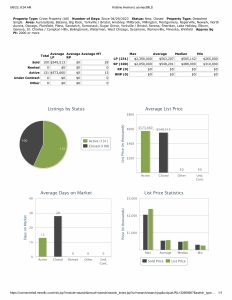
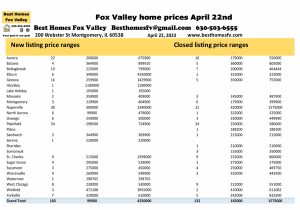
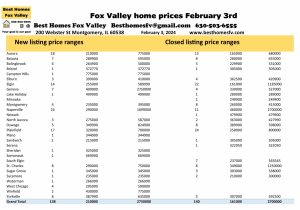
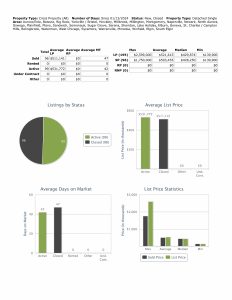
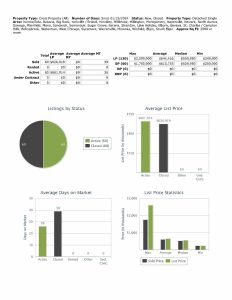
New listings this week are up. 138 this week compared to 119 the previous week.
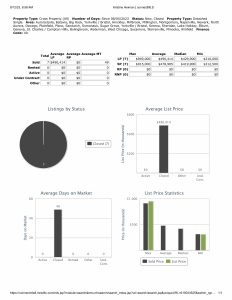
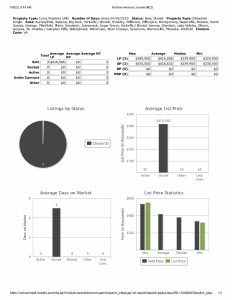
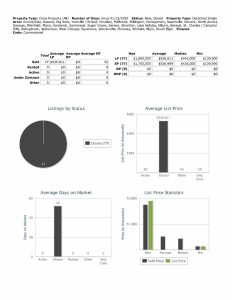
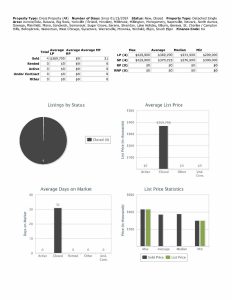
Closed listings are also up. 140 this week compared to 97 the previous week.
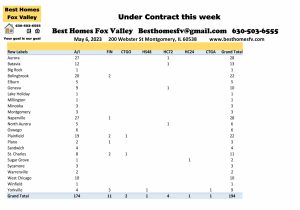
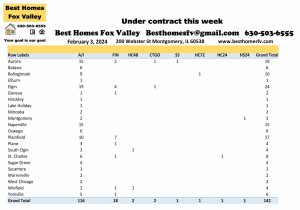
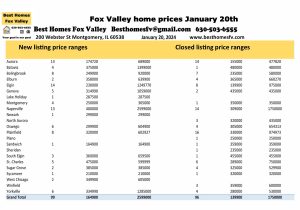
Take a look at the communities with the most activity this week and their price ranges.
Aurora-New 18 $210,000-$775,000
Closed-13 $165,000-$680,000
Elgin-New 14 $255,000-$589,990
Closed-22 $161,000-$1,185,000
Naperville-New 24 $290,000-$1,699,000
Closed-11 $460,000-$2,700,000
Plainfield-New 17 $320,000-$700,000
Closed-24 $250,000-$800,000
Look at the photo above for other communities that had activity and their price ranges.
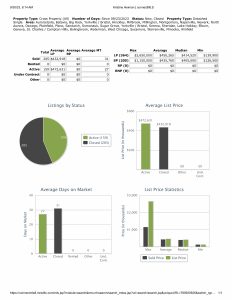
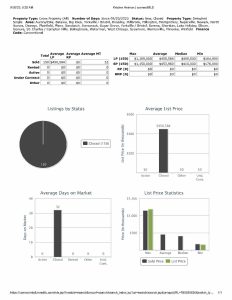
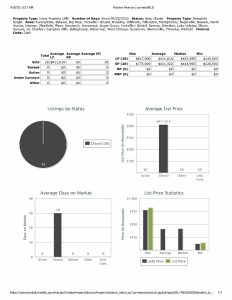
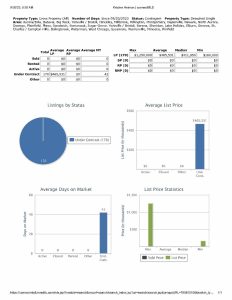
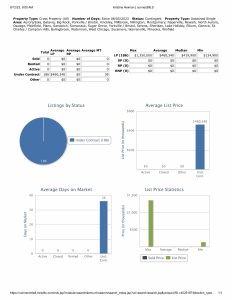
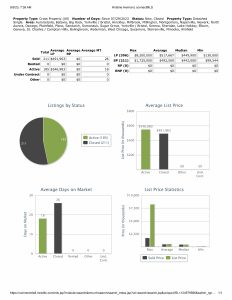
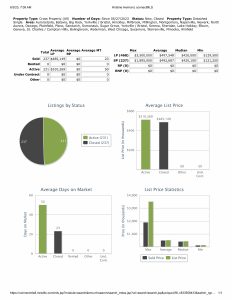
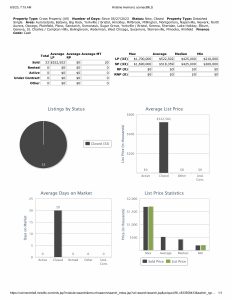
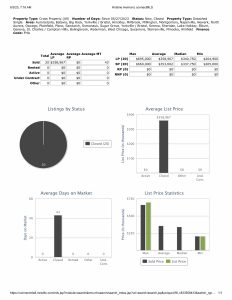
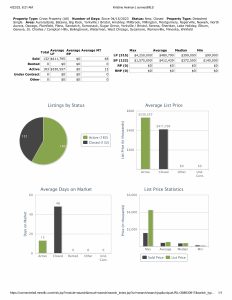
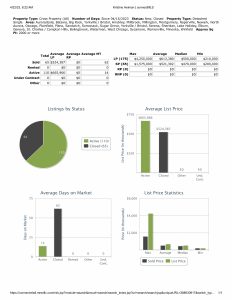
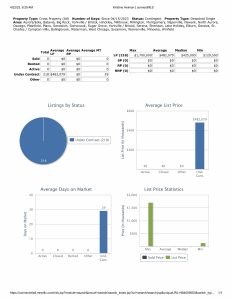
Financing used, median price, and 2,000 SF or more
Median list price this week $426,495, last week $411,450.
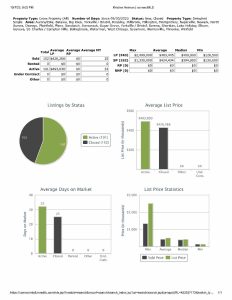
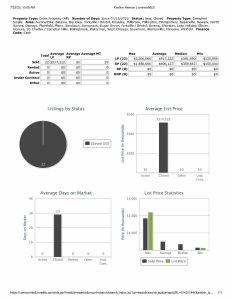
Closed median price this week $388,700, last week $381,000
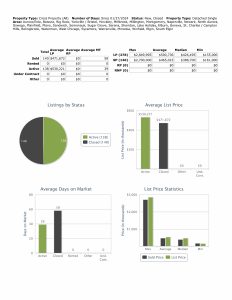
Conventional financing was used to close on 100 homes this week at median price $419,500 with 63 days average market time, last week 71 homes at median price $435,000 with 49 days average market time.
Cash was used to close on 19 homes this week at median price $400,000 with 37 days average market time, last week 15 homes at median price $350,000 with 20 days average market time.
FHA financing was used to close on 16 homes this week at median price $363,245 with 52 days average market time, last week 9 homes at median price $325,000 with 36 days average market time.
VA financing was used to close on 5 homes this week at median price $385,000 with 41 days average market time, last week 2 at median price $315,000 with 45 days average market time.

2,000 SF or more closed on 82 homes at median price $521,000 with 61 days average market time, last week 53 homes at median price $495,000 with 52 days average market time. Minimum price this week $249,900, last week $246,000.
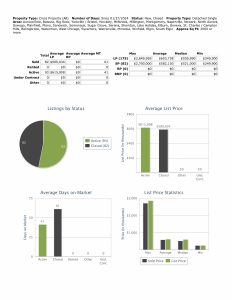
71% of homes closed using Conventional financing this week.
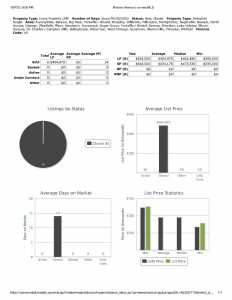
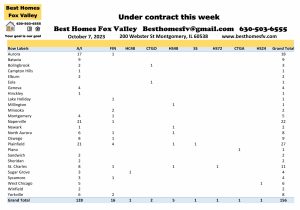
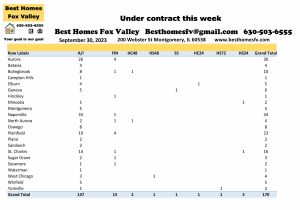
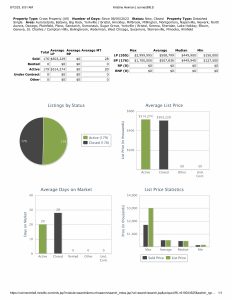
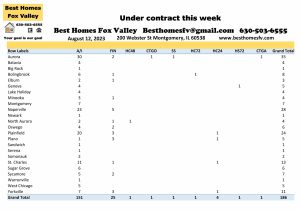
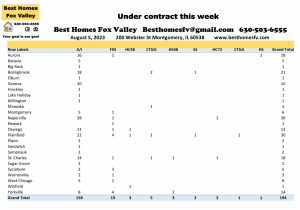
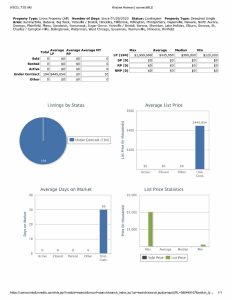
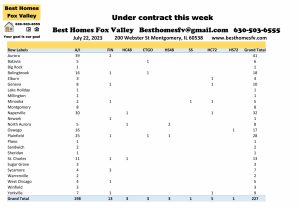
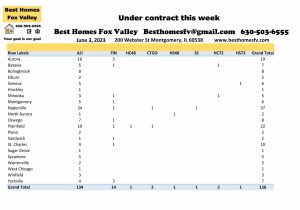
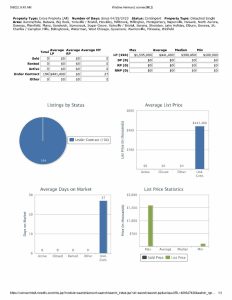
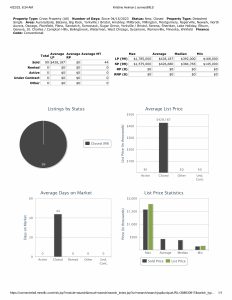
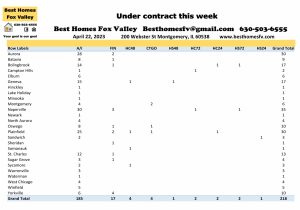
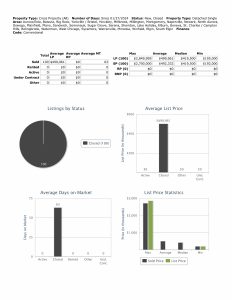
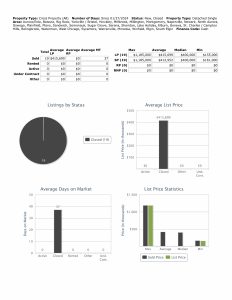
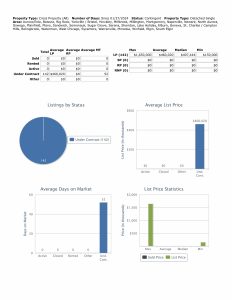
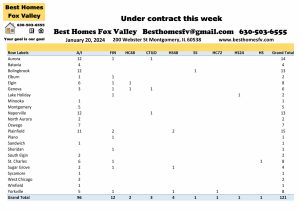
Under contract this week
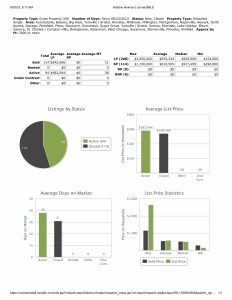
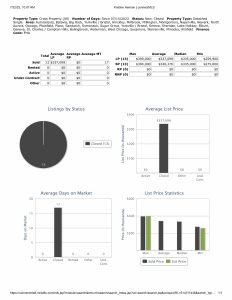
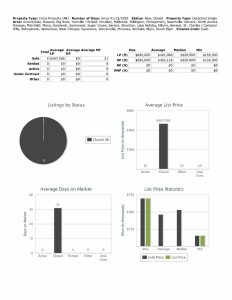
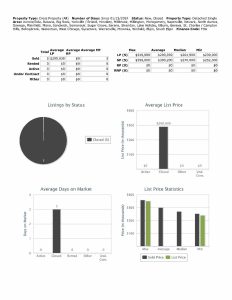
Homes that went under contract this week are up slightly. 142 this week compared to 131 the previous week.
Aurora-19 Bolingbrook-10
Elgin-24 Naperville-15
Plainfield-17
1 short sale was accepted by a seller this week. It was in Aurora. Now it will be submitted to the lender to see if they will also accept.
Seller’s accepted contracts that are contingent on the buyer closing on their current home. 1 with a kick-out clause of 72 hours, 2 with 48 hours, and 1 with 24 hours.
Also, a seller accepted a contract that is contingent on the buyer selling and closing on their current home. 1 with a kick-out clause of 24 hours.
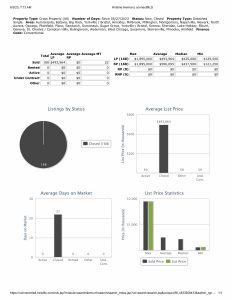
Median price of homes that went under contract this week $407,444 with 52 days average market time, last week median price $399,900 with 66 days average market time.
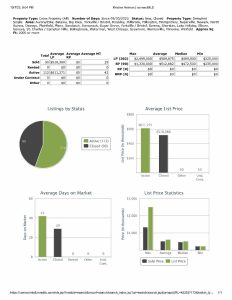
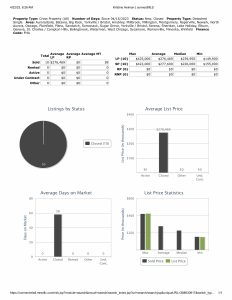
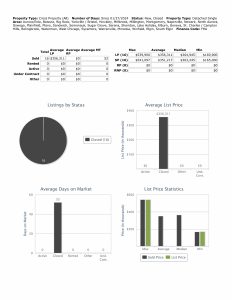
2024 by the month and a look back at 2023 and 2022
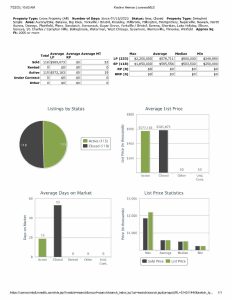
2024
Month New Closed Under contract
January 579 523 599
2023
January 483 326 470
2022
January 422 492 623
We waited until this week since there were 3 days this week still in January.
Check back with us every Saturday for the real estate market update for the Fox Valley area of Illinois.
Contact us
Call us at 630-503-6555 with all your real estate questions. Your goal is our goal.
All data provided today is downloaded from our MLS, MRED, LLC. It changes throughout the day.
Information for you to check out
- Types of loans and the process
- VA loans and the requirements
- Down payment assistance
- IHDA programs
- Request home valuation
- Sign-up for email alerts
- Search for a home anytime
Fox Valley home prices February 3rd. Have an awesome week!
Kristine Heiman, Designated Managing Broker
SFR, SRS, SRES, AHWD
200 Webster St
Montgomery, IL 60538
630-503-6555 Ext 101

 Fox Valley home prices October 7th. Temperatures have certainly changed since we changed to the fall season. 50’s for a high and we have seen some mid 30’s for a low.