Fox Valley home prices December 3rd

Fox Valley home prices December 3rd. It was a little busy yesterday so I didn’t get this posted.
We will show you the communities with the most activity listing prices, closed prices, contracts accepted this week, median prices, financing used, and 2022 by the month and a look back at 2021 and 2020 so you can see how this year is going. Resources for you to check out.
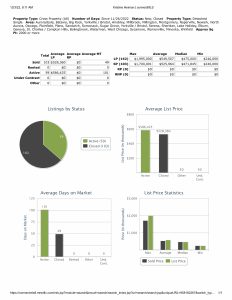
New listings this week were up. 105 this week compared to 80 the previous week.
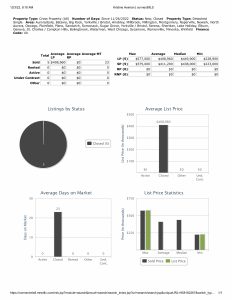
Closed listings were also up. 177 this week compared to 112 the previous week.
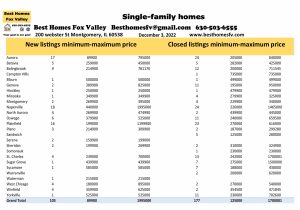
Aurora-New 17 $89,900-$795,000
Closed-24 $205,000-$840,000
Bolingbrook-New 9 $214,900-$781,170
Closed-12 $200,000-$711,545
Geneva-New 2 $389,900-$825,000
Closed-11 $195,000-$950,000
Naperville-New 18 $440,000-$1,995,000
Closed-24 $226,000-$1,465,000
Oswego-New 6 $379,900-$525,000
Closed-11 $240,000-$659,500
Plainfield-New 16 $199,000-$1,199,900
Closed-23 $270,000-$616,000
St Charles-New 4 $239,000-$700,000
Closed-13 $242,000-$1,700,001
Yorkville-New 1 $525,000
Closed-11 $230,000-$702,600
Click on the photo above to see the communities that also had activity.
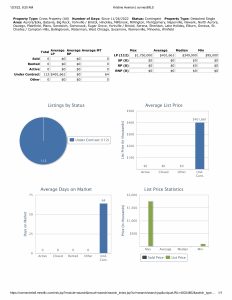
Financing used, median prices, and 2,000 SF or more
Median list price this week $392,495, last week $364,950.
Closed median price this week $380,000, last week $382,495.
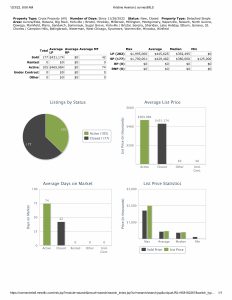
Conventional financing was used to close on 122 homes this week at median price $407,500 with 45 days average market time, last week 79 homes at median price $415,000 with 35 days average market time.
Cash was used to close on 22 homes this week at median price $352,250 with 34 days average market time, last week 9 homes at median price $475,000 with 26 days average market time.
FHA financing was used to close on 27 homes this week at median price $310,556 with 41 days average market time, last week 19 homes at median price $300,000 with 47 days average market time.
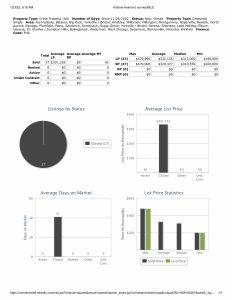
VA financing was used to close on 5 homes this week at median price $438,000 with 23 average market time, last week also 5 homes at median price $340,000 with 34 days average market time.
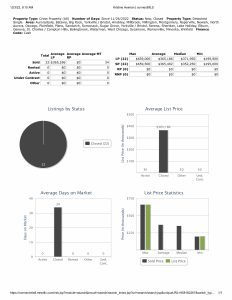
2,000 square feet or more closed on 103 homes this week at median price $471,845 with 49 days average market time, last week 69 homes at median price $460,000 with 34 days average market time. Minimum price this week $240,000, last week $267,000.
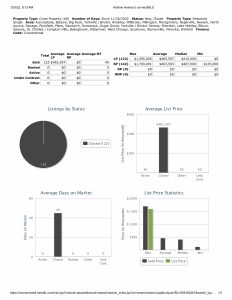
Contracts accepted this week
Contracts accepted this week were down. 112 this week compared to 132 the previous week.
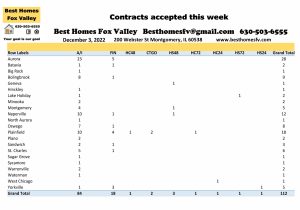
Aurora-28 Naperville-12
Plainfield-18
Take a look at the photo above for the other communities with activity.
No short sales were accepted by seller’s this week.
Seller’s accepted contracts that are contingent on the buyer closing on their current home. 1 each with a kick-out clause of 72 hours, 48 hours, and 24 hours.
Also, seller’s accepted contracts that are contingent on the buyer selling and closing on their current home. 1 with a kick-out clause of 72 hours, 3 with 48 hours, and 1 with 24 hours.
Median price that went under contract this week $349,900 with 64 days average market time, last week $375,000 with 54 days average market time.
2022 by the month and a look back at 2021 and 2020
2022
Month New Closed Contracts accepted
January 422 492 623
February 523 520 724
March 734 904 890
April 1168 966 1334
May 1101 893 806
June 1295 1409 1234
July 955 932 908
August 1019 1134 1062
September 730 733 698
October 699 612 646
November 574 764 624
Totals 9220 9359 9549
2021
January 543 649 829
February 561 604 778
March 993 1099 1455
April 1006 926 1387
May 1088 1288 1289
June 1450 1686 1671
July 1118 1182 1210
August 1109 1203 1170
September 1083 1411 1251
October 715 973 930
November 557 854 931
Totals 10223 11875 12901
2020
January 1105 566 858
February 1267 529 1024
March 1186 707 1079
April 648 786 775
May 1352 1010 1444
June 1232 908 1534
July 1417 1453 1852
August 1037 1335 1436
September 1176 1503 1503
October 843 1116 1159
November 567 985 699
Totals 11830 10898 13363
There were 2610 more new listings in 2020 than this year.
For November it is pretty consistent all 3 years.
Check back with us every Saturday for the real estate market update in the Fox Valley area of Illinois.
Resources
Click on everything that is bold and underlined so it will take you to the site for the information.
- Types of loans and the process
- VA loans and the requirements
- Current interest rates
- Down payment assistance
- IHDA programs
- Request home valuation
- Sign-up for email alerts
- Search for homes
Check with your loan officer to see the interest rate you will be offered. It depends on your credit score and other things that they will explain to you.
You can connect with us on Facebook and search for homes there as well. Click on the “shop now” button and search anywhere in Illinois.
All data provided was downloaded yesterday morning from our MLS, MRED, LLC. It changes continuously throughout the day.
Contact us
Call us at 630-503-6555 with all your real estate questions. Your goal is our goal.
Fox Valley home prices December 3rd. Have an awesome week!
Kristine Heiman, SFR, SRS, SRES, AHWD
Designated Managing Broker
Best Homes Fox Valley
200 Webster St
Montgomery, IL 60538
630-503-6555 Ext 101