Fox Valley home prices October 15th

Fox Valley home prices October 15th. Changes are happening here in the Fox Valley area of Illinois. Trees are changes colors and are gorgeous. Temperatures are starting to lower. It is starting to get dark earlier.
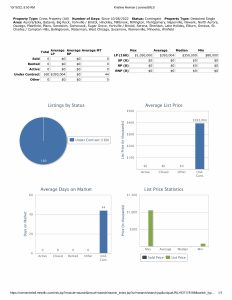
You will see the prices in the different communities for new listings and closed. Financing most used, median prices and contracts accepted this week. You will also see 2022 by the month so you can see how this year is going.
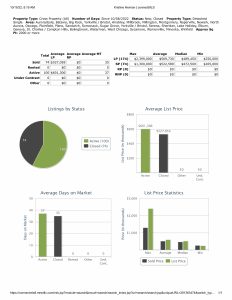
New listings this week are down. 173 this week compared to 200 the previous week.
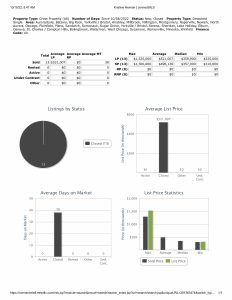
Closed listings were also down. 132 this week compared to 182 the previous week.
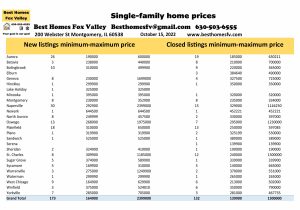
Aurora-New 26 $190,000-$600,000
Closed-19 $185,000-$630,211
Bolingbrook-New 10 $310,000-$499,900
Closed-9 $220,000-$365,000
Naperville-New 30 $292,900-$2,399,000
Closed-15 $329,000-$1,144,250
Oswego-New 13 $268,000-$1,975,000
Closed-7 $295,000-$1,230,000
Plainfield-New 18 $310,000-$650,000
Closed-13 $250,000-$597,085
St Charles-New 8 $309,900-$1,185,000
Closed-12 $240,000-$1,300,000
Other communities had activity this week. We just highlighted the ones with the most activity. You can click on the photo above to see the other communities.
Financing used, median prices and 2,000 SF or more
Median list price this week $383,585, last week $400,000.
Closed median price this week $361,000, last week $390,000.
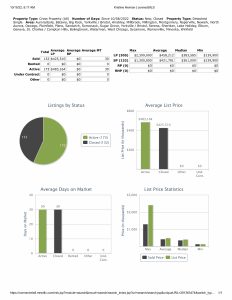
Conventional financing was used to close on 85 homes at a median price $405,000 with 31 days average market time, last week 122 homes at median price $397,500 with 32 days average market time.
Cash was used to close on 11 homes this week with a median price $390,000 with 26 days average market time, last week 29 homes at median price $425,000 with 29 days average market time.
FHA financing was used to close on 22 homes this week at median price $305,000 with 20 days average market time, last week 21 homes at median price $290,000 with 34 days average market time.
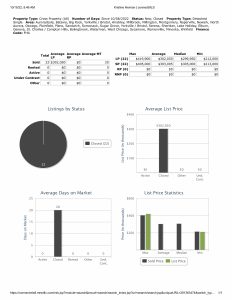
VA financing was used to close on 13 homes this week at median price $357,000 with 38 days average market time, last week 10 homes at median price $442,500 with 36 days average market time.
2,000 square foot or more homes closed on 74 this week with a median price $472,500 with 35 days average market time, last week 108 homes at median price $491,000 with 36 days average market time. Minimum price this week $265,000, last week $179,900.
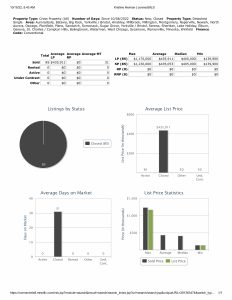
Contracts accepted this week
Contracts accepted this week were slightly down. 160 this week compared to 170 the previous week.
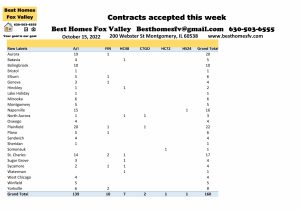
Aurora-20 Bolingbrook-10
Naperville-16 Plainfield-22
St Charles-17
No short sales received contracts this week.
Seller’s accepted contracts that are contingent on the buyer closing on their current home. 1 with a kick-out clause of 72 hours and 7 with 48 hours.
Also, a seller accepted a contract that is contingent on the buyer selling and closing on their current home. 1 with a kick-out of 24 hours.
Median price of homes that went under contract this week $350,000 with 44 days average market time, last week median price $377,450 with 47 days average market time.
2022 by the month
Month New Closed Contracts accepted
January 422 492 623
February 523 520 724
March 734 904 890
April 1168 966 1334
May 1101 893 806
June 1295 1409 1234
July 955 932 908
August 1019 1134 1062
September 730 733 698
October 373 314 330
Totals 8320 8297 8609
Most of the activity was between April and August. At the end of the month we will also show you 2021 and 2020 by the month so you can compare it to this year.
Resources
Click on everything that is bold and underlined and it will take you to the site for the information.
- Types of loans and the process
- VA loans and the requirements
- current interest rates
- Down payment assistance
- IHDA program
- Request a home valuation
- Sign-up for email alerts
- Search for homes
Check with your loan officer to see what interest rate you will offered. It depends on your credit score and a few other things that they will discuss with you.
You can find us on Facebook and also search for homes there by clicking on the “shop now” button. There is a drop down arrow that lets you choose your criteria.
All data provided is from our MLS, MRED, LLC. The data changes constantly throughout the day as agents upload their information.
Contact us
Call us at 630-503-6555 with all your real estate questions. Your goal is our goal.
Fox Valley home prices October 15th. Have an awesome week!
Kristine Heiman, SFR, SRS, SRES, AHWD
Designated Managing Broker
Best Homes Fox Valley
200 Webster St
Montgomery, IL 60538
630-503-6555 ext 101