Fox Valley home prices October 8th

Fox Valley home prices October 8th. This is the first full week of October. We show you the price ranges of each community with activity. What kind of financing was used to close. Median prices and which communities accepted the most contracts this week.
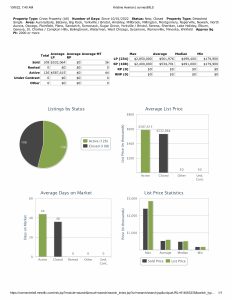
New listings this week were up. 200 this week compared to 169 the previous week.
Closed listings were down. 182 this week compared to 247 the previous week.
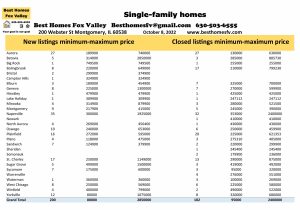
Aurora-New 27 $189,900-$740,000
Closed-27 $130,000-$630,000
Bolingbrook-New 8 $220,000-$649,000
Closed-17 $210,000-$799,230
Naperville-New 35 $300,000-$1,925,000
Closed-32 $353,000-$240,000
Oswego-New 10 $240,000-$653,000
Closed-6 $250,000-$459,900
Plainfield-New 16 $272,000-$595,000
Closed-20 $225,000-$621,353
St Charles-New 17 $250,000-$1,149,000
Closed-13 $290,000-$875,000
Yorkville-New 12 $80,000-$1,075,000
Closed-8 $320,000-$680,000
Click on the photo above to see other communities that had activity this week as well. We are just highlighting the communities with the most activity.
Financing used, median prices and 2,000 SF or more
Median list price this week $400,000, last week $395,000.
Closed median price this week $390,000, last week $392,900.
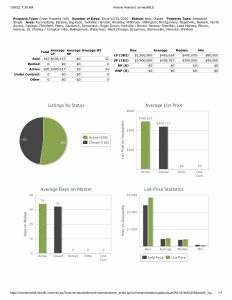
Conventional financing was used to close on 122 homes this week with a median price $397,500 with 32 days average market time, last week 165 homes at median price $405,000 with 28 days average market time.
Cash was used to close on 29 homes this week with a median price $425,000 with 29 days average market time, last week 38 homes at median price $405,000 with 37 days average market time.
FHA financing was used to close on 21 homes this week with a median price $290,000 with 34 days average market time, last week 30 homes at median price $266,500 with 27 days average market time.

VA financing was used to close on 10 homes at median price $442,500 with 36 days average market time, last week 12 homes at median price $385,500 with 32 days average market time.

2,000 square feet or more closed on 108 homes at median price $491,000 with 36 days average market time, last week 154 homes at median price $465,000 with 30 days average market time. Minimum price this week was $179,900, last week $220,000.
Contracts accepted this week
Contracts accepted this week were consistent. 170 this week compared to 168 the previous week.
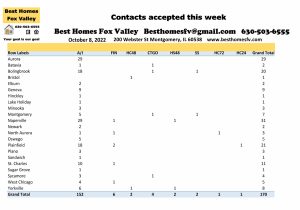
Aurora-29 Bolingbrook-20
Naperville-31 Plainfield-21
St Charles-11
2 short sales were accepted by seller’s this week 1 in Bolingbrook and 1 in Montgomery. Now they will be submitted to the lender to see if they will also accept.
Seller’s accepted contracts that are contingent on the buyer closing on their current home. 1 with a kick-out clause of 72 hours, 2 with 48 hours, and 1 with 24 hours.
Also, sellers accepted contracts that are contingent on the buyer selling and closing on their current home. 2 with a kick-out clause of 48 hours.
Median price of homes that went under contract this week $377,450 with 47 days average market time, last week $359,900 with 39 days average market time.
2022 by the month
Month New Closed Contracts accepted
January 422 492 623
February 523 520 724
March 734 904 890
April 1168 966 1334
May 1101 893 806
June 955 1409 1234
July 1295 932 908
August 1019 1134 1062
September 730 733 698
October 200 182 170
Totals 8147 8165 8449
Check back with us every Saturday for the real estate market update in the Fox Valley area of Illinois. At the end of the month we will also show you 2021 and 2020 so you can compare to see how this year is going.
Resources
click on everything that is bold and underlined and it will take you to the site for the information. If you are looking for any other information not listed please let us know and we would be happy to point you in the right direction.
- Type of loans and the process
- VA loans and the requirements
- Current interest rates
- Down payment assistance
- IHDA programs
- Request a home valuation
- Sign-up for email alerts
- Search for homes
Check with your loan officer to see the rate you will be offered. It depends on your credit score. They will help you if you need to work on it.
You can also connect with us on facebook and search for homes there. Just click on the “shop now” button and search anytime you like.
All data provided today is from our MLS, MRED, LLC. It constantly changes throughout the day as agents upload their information so go back and check if you are not signed up for email alerts.
Contact us
Call us at 630-503-6555 with all your real estate questions. Your goal is our goal.
Fox Valley home prices October 8th. Have an awesome week!
Kristine Heiman, SFR, SRS, SRES, AHWD
Designated Managing Broker
Best Homes Fox Valley
200 Webster St
Montgomery, IL 60538
630-503-6555 ext 101