Fox Valley area of Illinois home prices April 4th
Fox Valley area of Illinois home prices April 4th.
It is 49 degrees and cloudy right now. This next week we should see highs from 44-66 degrees and lows from 23-51 degrees.
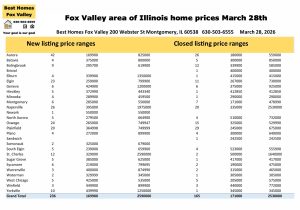
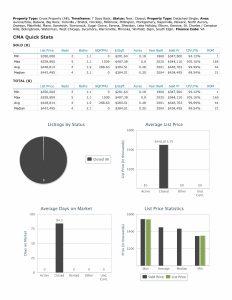
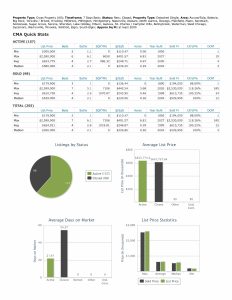
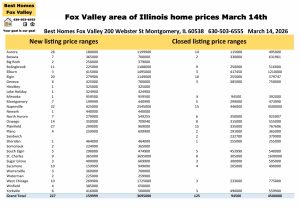
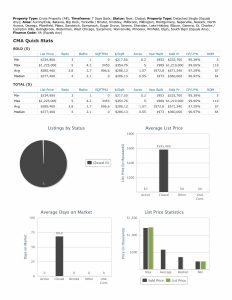
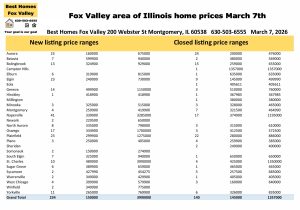
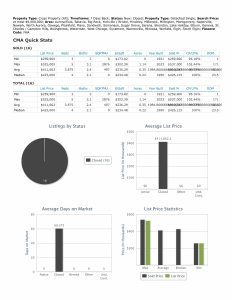
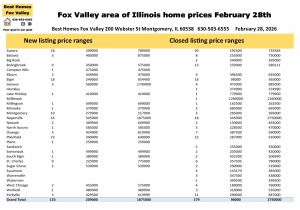
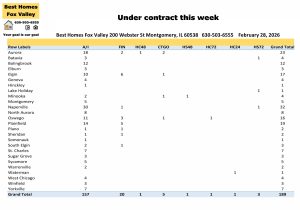
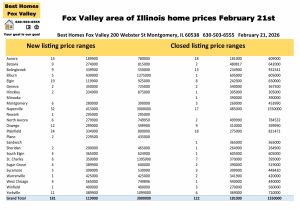
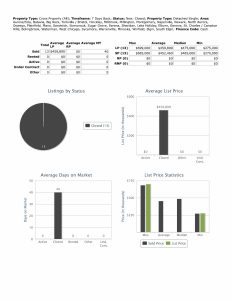
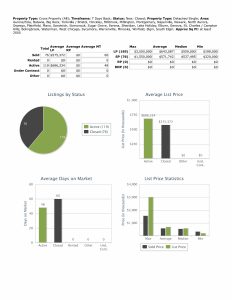
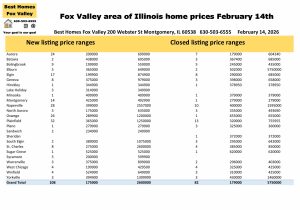
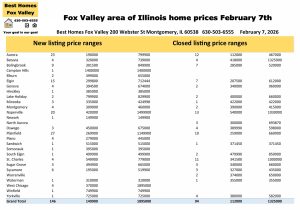
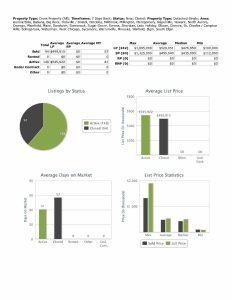
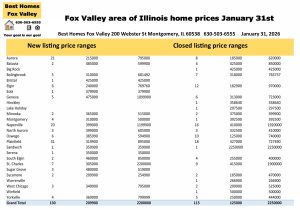
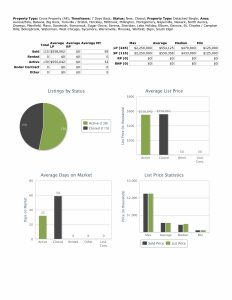
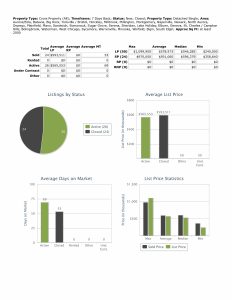
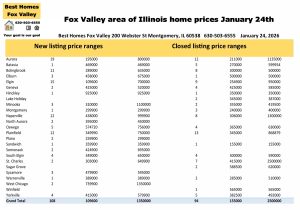
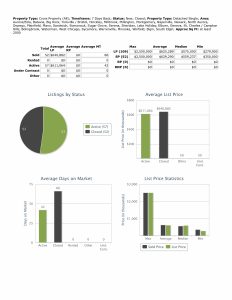
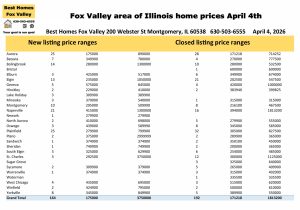
164 new listings in the Fox Valley this week with 192 Closed listings.
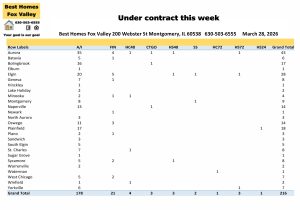
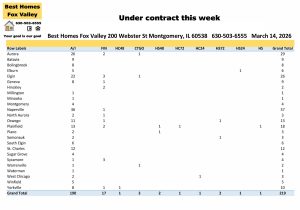
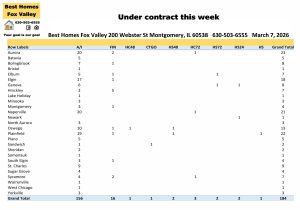
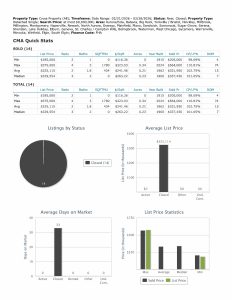
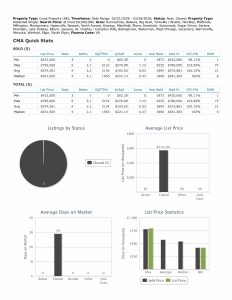
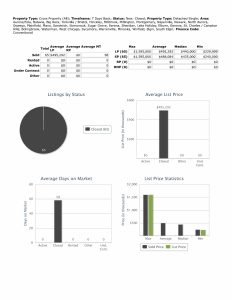
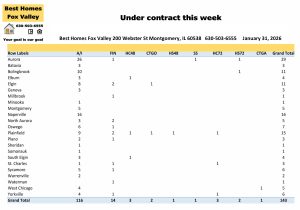
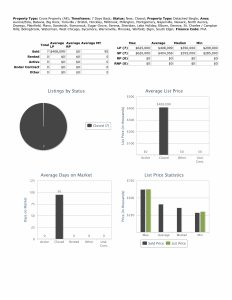
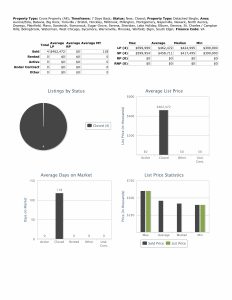
Aurora New-25 $175,000-$890,000
Closed-28 $171,218-$714,252
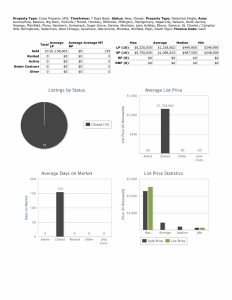
Bolingbrook New-14 $280,000-$1,300,000
Closed-10 $280,000-$532,500
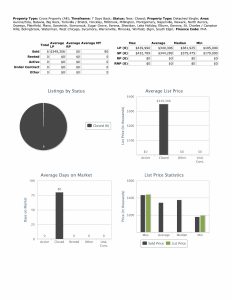
Elgin New-13 $235,000-$1,050,000
Closed-21 $202,500-$547,500
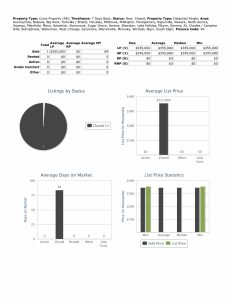
Montgomery New-10 $295,000-$509,990
Closed-8 $216,100-$467,500
Naperville New-21 $415,000-$1,300,000
Closed-16 $394,000-$1,813,200
Plainfield New-25 $279,900-$799,900
Closed-32 $305,000-$827,500
St Charles New-3 $292,500-$3,750,000
Closed-12 $300,000-$1,125,000
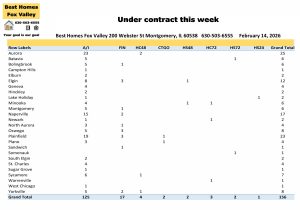
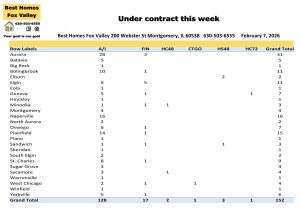
Other communities had activity this week. Please look at photo above to see them and their price ranges.
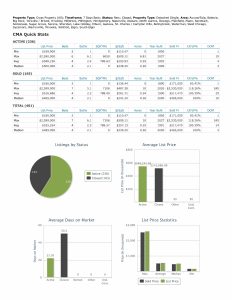
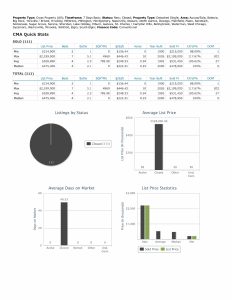
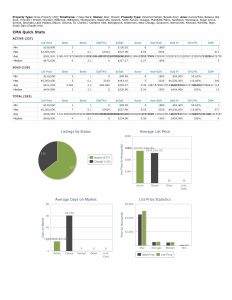
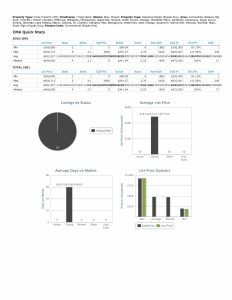
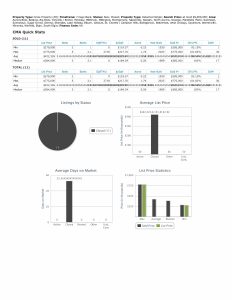
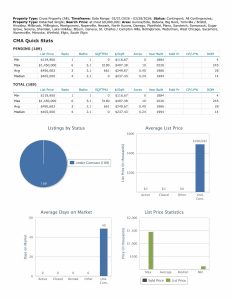
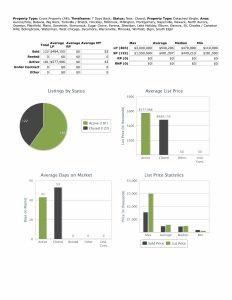
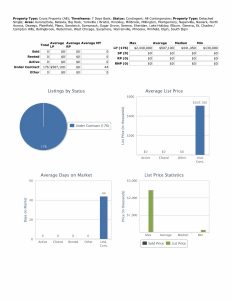
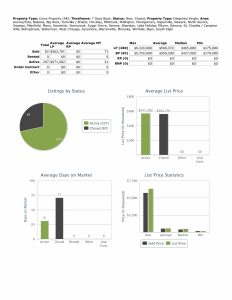
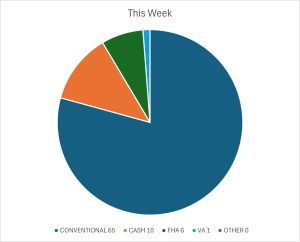
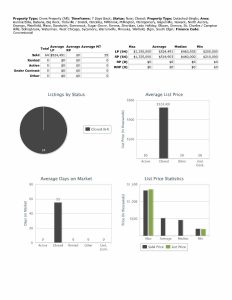
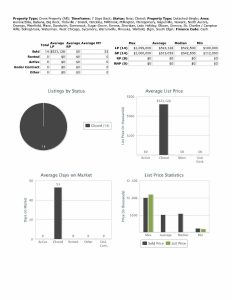
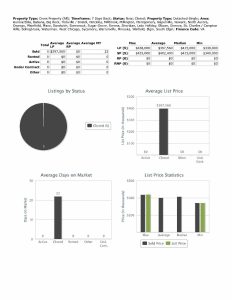
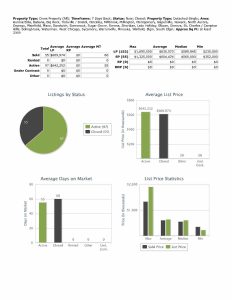
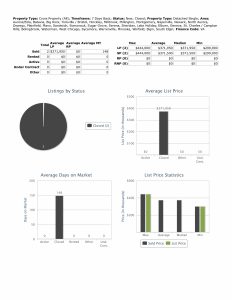
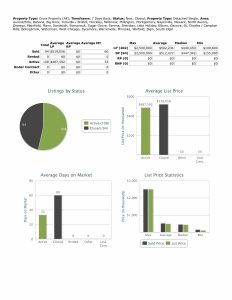
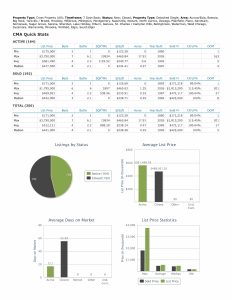
Financing used, median prices, and 2,000 SF or more
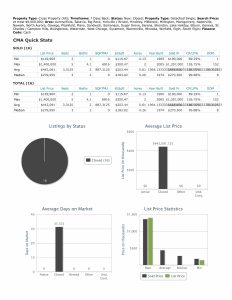
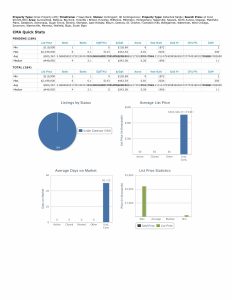
New listing median price this week $477,500 and Closed median price this week $422,000
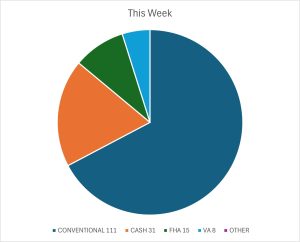
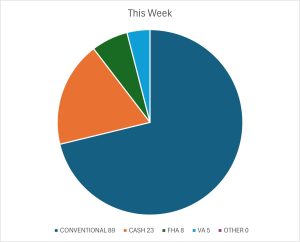
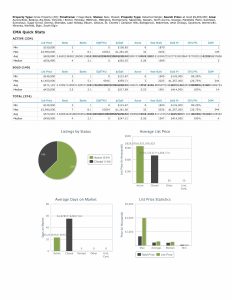
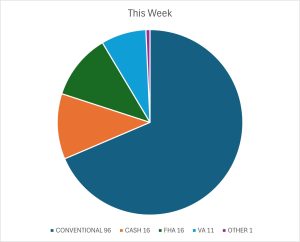
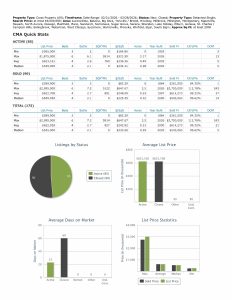
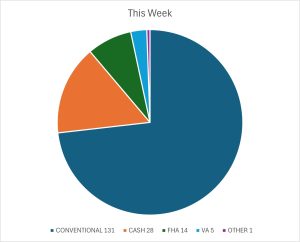
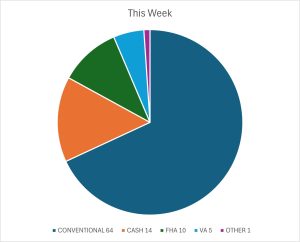
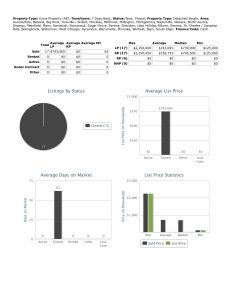
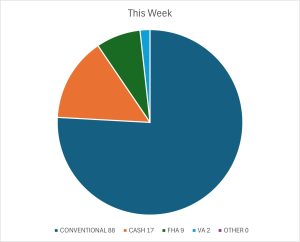
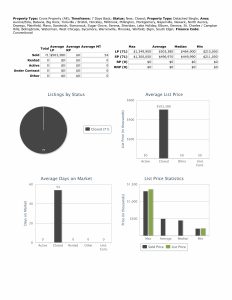
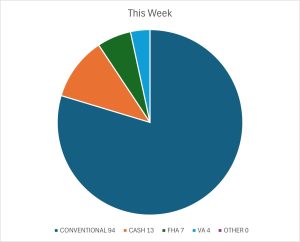
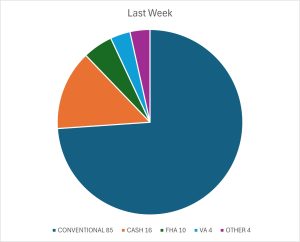
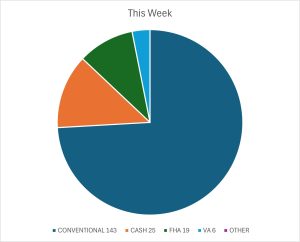
Conventional financing was used to close on 143 homes this week at median price $439,900 with 23 days average market time.
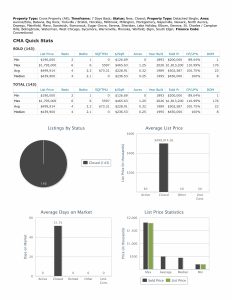
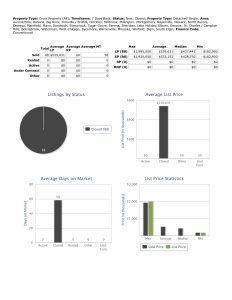
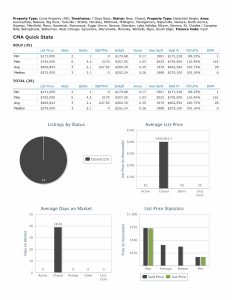
Cash was used to close on 25 homes this week at median price $375,000 with 28 days average market time.
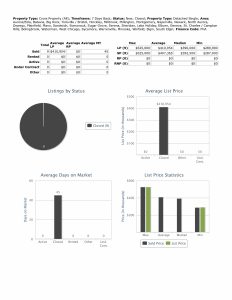
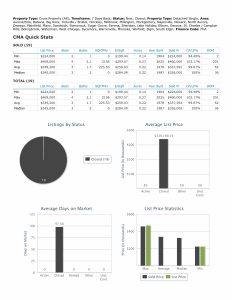
FHA financing was used to close on 19 homes this week at median price $345,000 with 62 days average market time.
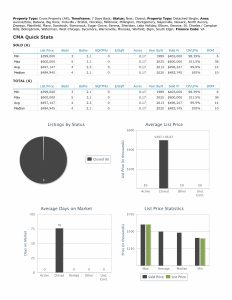
VA financing was used to close on 6 homes this week at median price $484,945 with 14 days average market time.
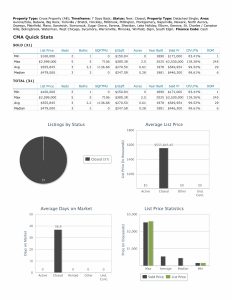
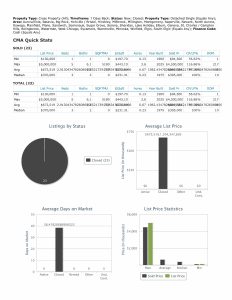
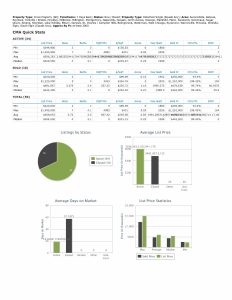
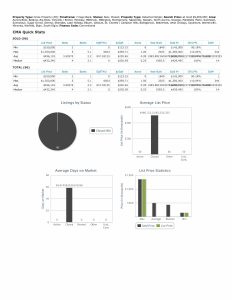
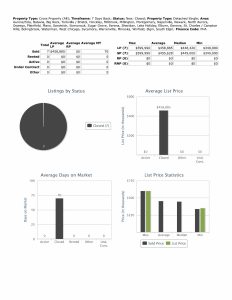
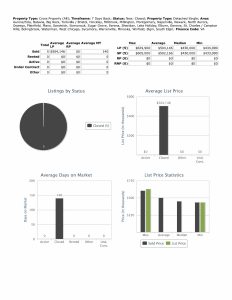
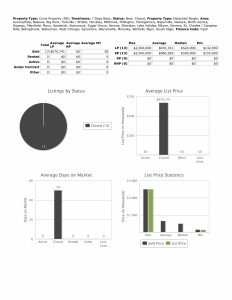
2,000 SF or more closed on 98 homes this week at median price $599,945 with 6 days average market time. Minimum price this week $225,000.

Over 74% of homes closed this week used conventional financing and over 51% of homes closed were at least 2,000 SF or more.
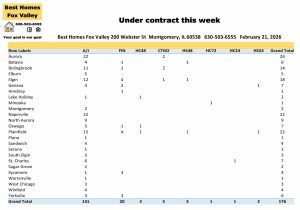
2026 and a look back at 2025 and 2024
2026
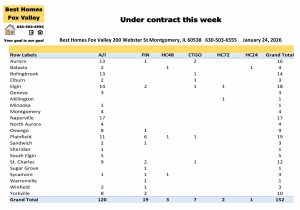
Month New Closed Under contract
January 526 416 392
February 668 477 673
March 1076 778 1086
Totals 2270 1671 2151
2025
January 585 590 652
February 609 504 590
March 785 569 746
Totals 1979 1663 1988
2024
January 576 523 599
February 637 416 691
March 674 612 792
Totals 1887 1551 2082
You can see this year there are more new listings. Closings are pretty close. There are more under contract but not all of those are closing.
Check back with us every Saturday for the real estate market update for the Fox Valley area of Illinois.
Call us
Call use with your real estate questions. Your goal is our goal.
If you are thinking about buying a home you will need to get your tax returns and financial information together and contact a loan officer to get pre approved. Then you will be ready to start looking at homes.
Open houses are for anyone to look. Showings are for qualified buyer’s to look with an agent.
To find information about the process look here. Scroll down to see the guides and videos explaining the process.
Finding out an estimate of what your home is worth fill out this form and give us a little information about your home an we will set up an appointment to view it and give you an estimate.
Sign-up for email alerts and get homes with your criteria as they hit the market.
You can also search for a home anytime.
All data used today was downloaded from our MLS. MRED, LLC. It changes throughout the day.
Fox Valley area of Illinois home prices April 4th.
Have an awesome week!
Kristine Heiman, Managing Broker
ABR, AHWD, SFR, SRES, SRS
200 Webster St
Montgomery, IL 60538
630-503-6555 Ext 101