Fox Valley area of Illinois home prices February 21st
Fox Valley area of Illinois home prices February 21st.
It is 28 degrees and cloudy right now. This next week we should see highs from 29-51 degrees and lows from 16-29 degrees.
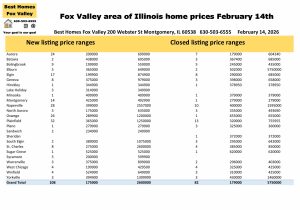
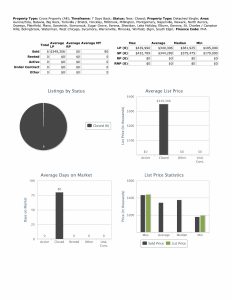
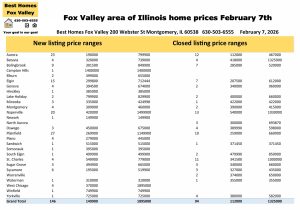
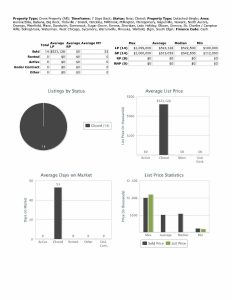
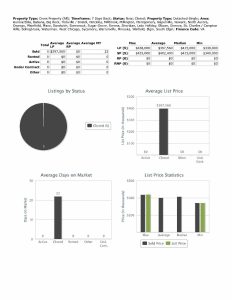
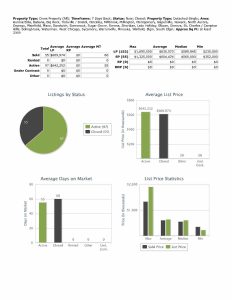
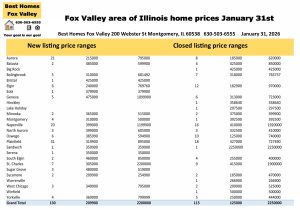
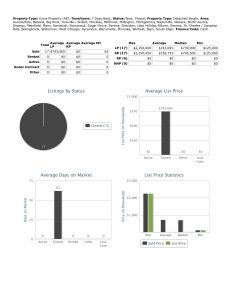
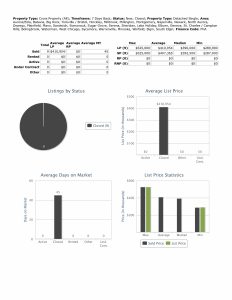
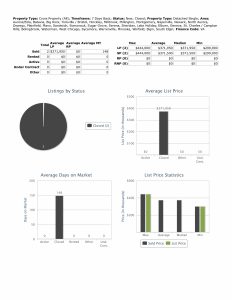
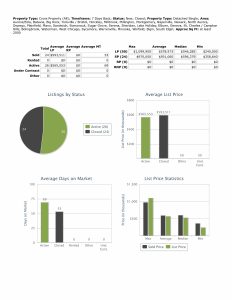
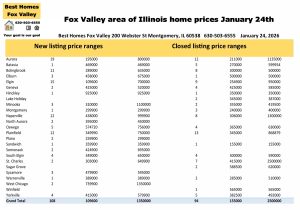
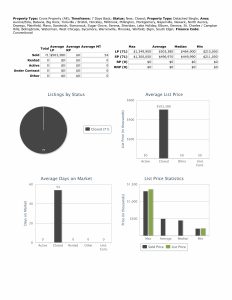
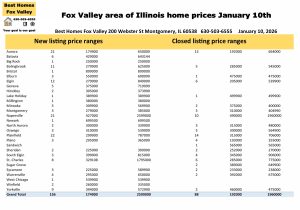
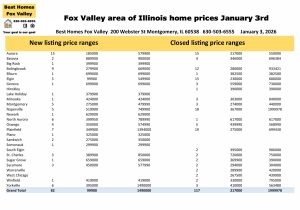
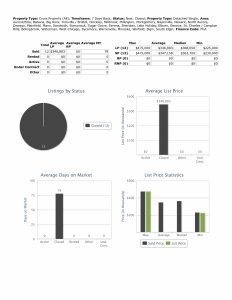
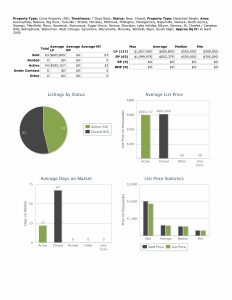
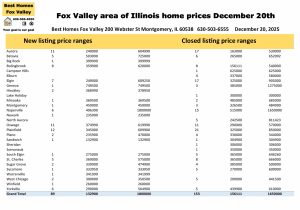
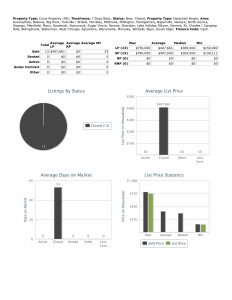
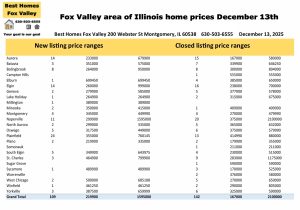
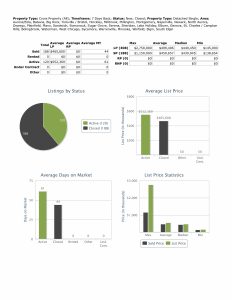
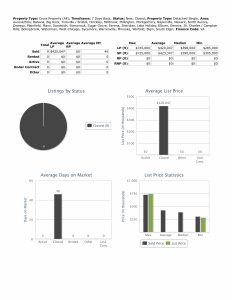
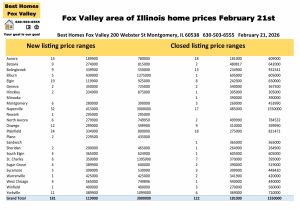
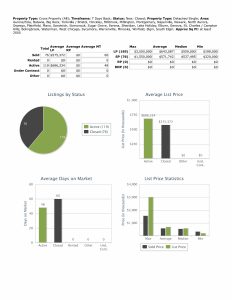
181 new listings this week and 122 closed listings.
Here are the communities with the most activity this week.
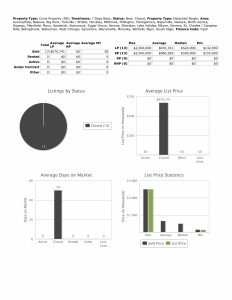
Aurora New-14 $189,900-$780,000
Closed-18 $181,000-$609,000
Bolingbrook New-9 $339,900-$550,000
Closed-13 $234,900-$932,341
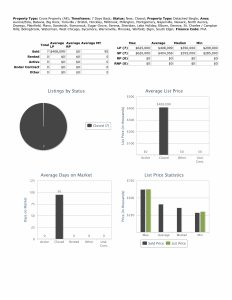
Elgin New-19 $119,900-$925,000
Closed-8 $242,000-$650,000
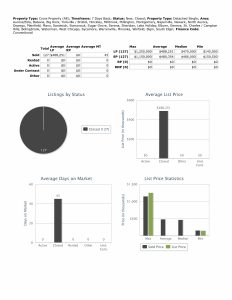
Naperville New-32 $415,000-$3,000,000
Closed-17 $485,000-$1,550,000
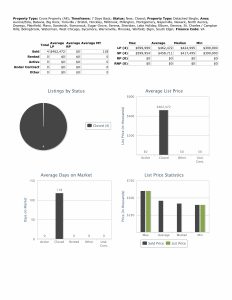
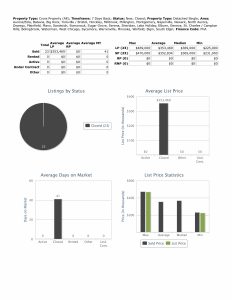
Oswego New-12 $299,000-$599,900
Closed-9 $310,000-$599,990
Plainfield New-24 $334,900-$800,000
Closed-18 $275,000-$821,471
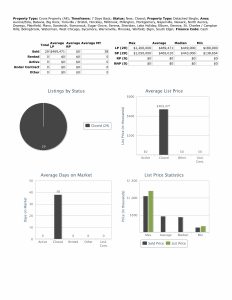
Yorkville New-11 $389,900-$1,099,000
Closed-6 $369,000-$710,000
If you do not see the price range you are looking for please look at the photo above and see if another community has what you are looking for.
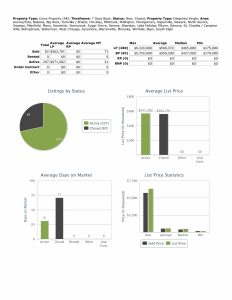
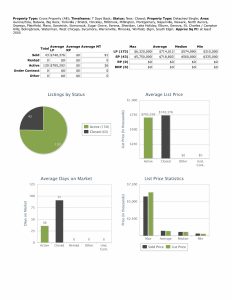
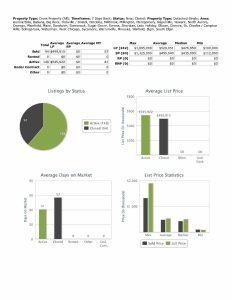
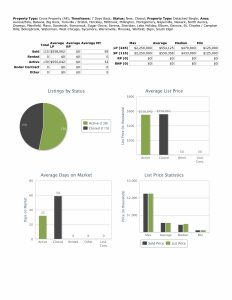
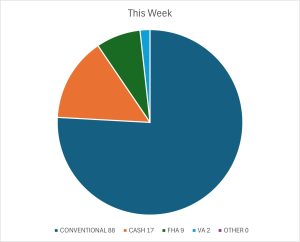
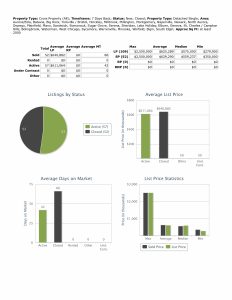
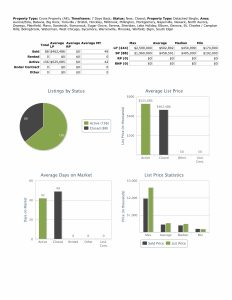
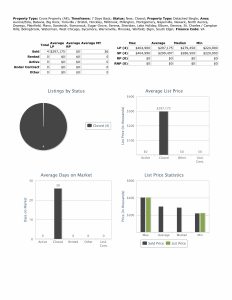
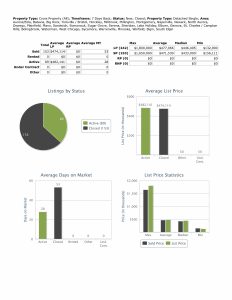
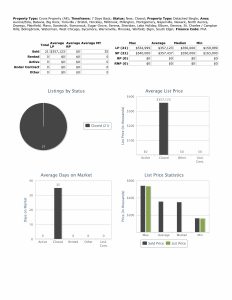
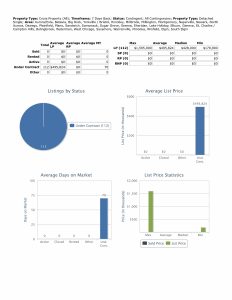
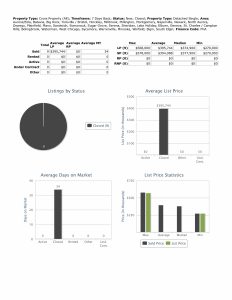
Financing used, median prices, and 2,000 SF or more
Median list price this week $479,990. Closed median price this week $449,210.
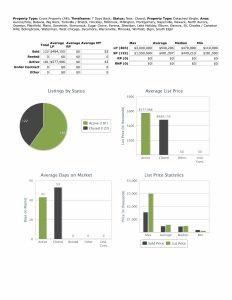
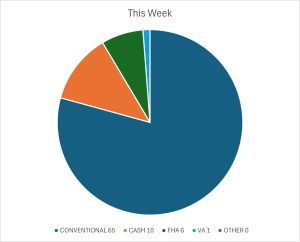
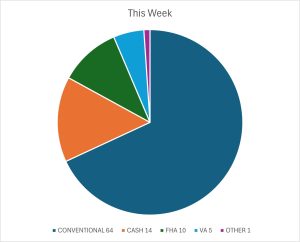
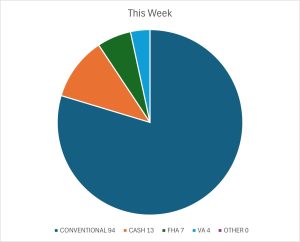
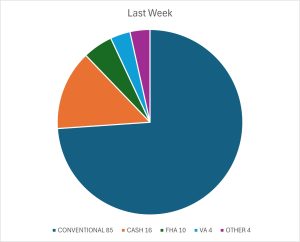
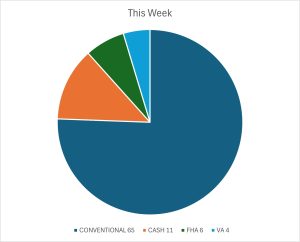
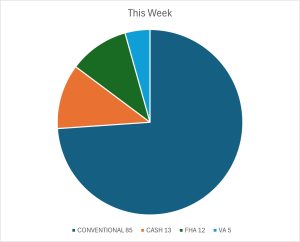
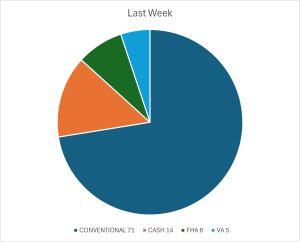
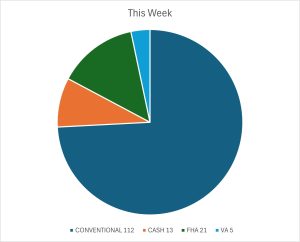
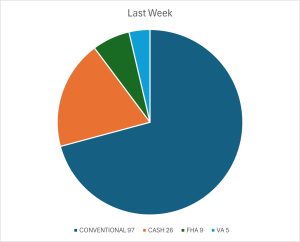
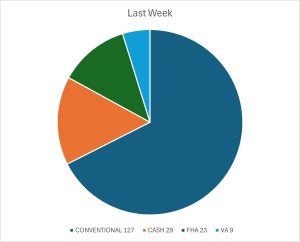
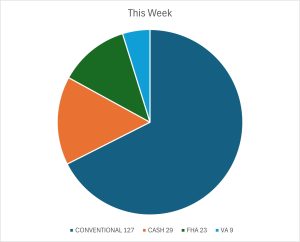
Conventional financing was used to close on 96 homes this week at median price $453,122 with 49 days average market time.

Cash was used to close on 13 homes this week at median price $485,000 with 40 days average market time.
FHA financing was used to close on 7 homes this week at median price $445,000 with 70 days average market time.
VA financing was used to close on 5 homes this week at median price $450,000 with 140 days average market time.
2,000 SF or more closed on 76 homes this week at median price $537,495 with 60 days average market time. Minimum price this week $320,000.
Over 78% of homes closed this week used conventional financing and over 62% of homes close this week were at least 2,000 SF or more.

This is important when you are going to submit an offer. Chances of winning are better if you are using conventional financing.
Not every home has the square footage on there so this number might be off but if that is what you are looking for this gives you an idea of what that size home is selling for on average and the minimum this week.
One was not reported on the usual choices so it might of been a rehab loan.
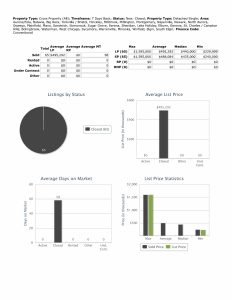
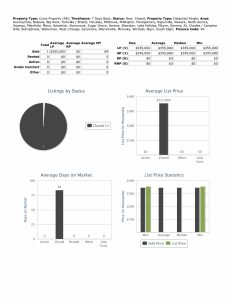
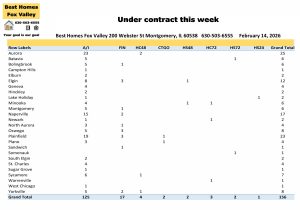
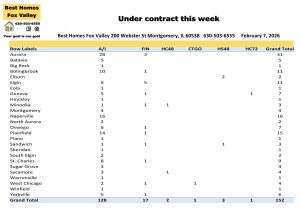
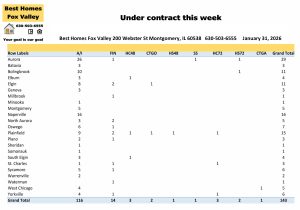
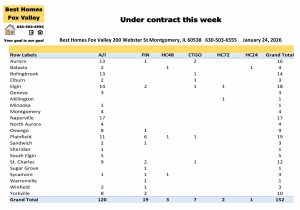
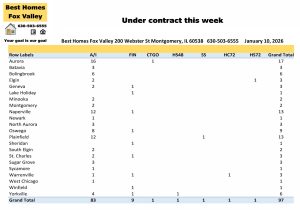
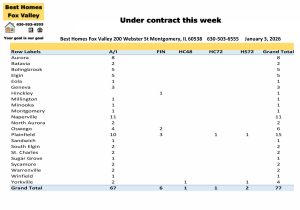
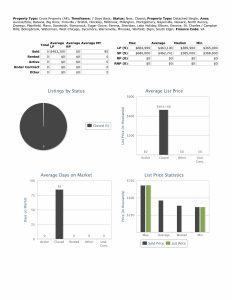
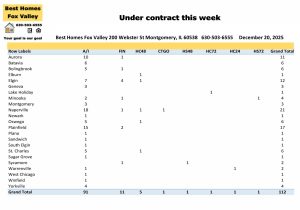
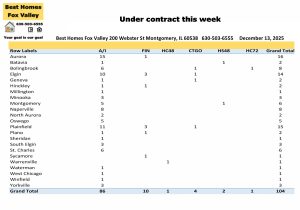
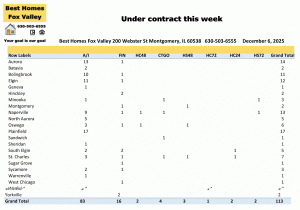
Under contract this week
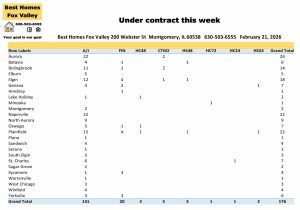
176 homes went under contract this week.
Aurora-24 Bolingbrook-14
Elgin-18 Naperville-22
Plainfield-22
No short sales were accepted by seller’s this week.
Seller’s accepted contracts that are contingent on the buyer closing on their current home. 1 with a kick-out clause of 72 hours, 3 with 48 hours, and 1 with 24 hours.
Also, seller’s accepted contracts that are contingent on the buyer selling and closing on their current home. 3 with a kick-out clause of 48 hours and 2 with 24 hours.
Under contract median price this week $441,450 with 44 days average market time.

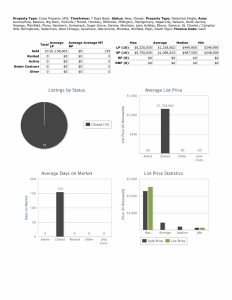
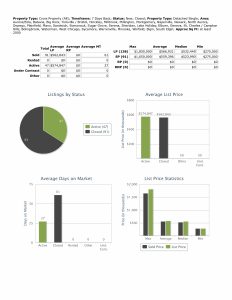
2026 by the month
Month New Closed Under contract
January 526 416 392
February 535 298 484
So far this month we are already above the total of new listings and contracts accepted and we still have another week to go.
The important one though is the closed homes and they are below last month so far. Maybe this next week it will catch up.
Check back with us every Saturday for the real estate market update for the Fox Valley area of Illinois. At the end of each month we will also take a look back at 2025 and 2024 so you have something to compare to.
Contact us
Call us at 630-503-6555 with all your real estate questions. Your goal is our goal.
You can see guides and some videos about the process at nar.realtor/the-facts and scroll down.
Go to request a home valuation if you want an estimate of what your home is worth in today’s market. You will also get a net proceeds to give you an idea of what you might walk away with at closing.
Sign-up foremail alerts if you want to know when homes come on the market with your criteria.
Search for a home anytime.
All data provided today was downloaded from our MLS, MRED, LLC. It changes throughout the day.
Fox Valley area of Illinois home prices February 21st. Have an awesome week!
Kristine Heiman, Managing Broker
ABR, AHWD, MRP, SFR, SRES, SRS
200 Webster St
Montgomery, IL 60538
630-503-6555 Ext 101