Fox Valley home prices December 30th
Fox Valley home prices December 30th. Mid 30’s for the next couple of weeks. More seasonal temperatures then what we have been having.
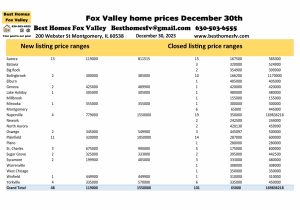
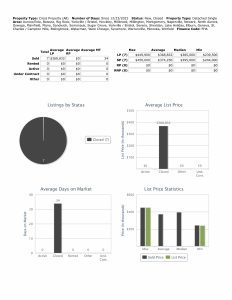
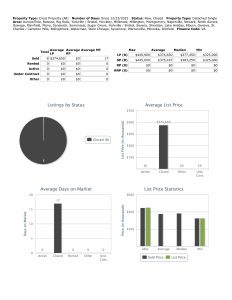
New listings are slightly up. 48 this week compared to 38 the previous week.
Closed listings are down. 101 this week compared to 126 the previous week.
It is the holidays so things are slower right now.
Aurora-New 13 $119,000-$811,515
Closed-15 $167,500-$585,000
Bolingbrook-New 2 $300,000-$385,000
Closed-10 $166,200-$1,170,000
Naperville-New 4 $779,000-$1,550,000
Closed-19 $350,000-$169,836,218
Plainfield-New 11 $320,000-$1,050,000
Closed-14 $287,000-$600,000
Hopefully after the 1st of the year we will see more listings come onto the market.
Financing used, median price, and 2,000 SF or more
Median list price this week $399,900, last week $392,222.
Closed median price this week $390,000, last week $382,500.
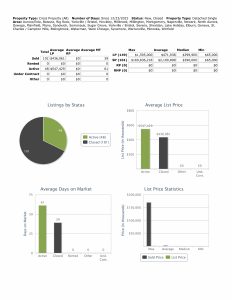
Conventional financing was used to close on 71 homes this week at median price $399,900 with 40 days average market time, last week 93 homes at median price $412,000 with 46 days average market time.
Cash was used to close on 15 homes this week at median price $355,000 with 50 days average market time, last week 21 homes at median price $354,000 with 33 days average market time.
FHA financing was used to close on 7 homes this week at median price $395,000 with 34 days average market time, last week 11 homes at median price $318,000 with 22 days average market time.
VA financing was used to close on 8 homes this week at median price $383,250 with 17 days average market time, last week 1 home at $303,750 with 6 days average market time.
2,000 SF or more closed on 55 homes this week at median price $465,000 with 43 days average market time, last week 64 homes at median price $442,500 with 59 days average market time. Minimum price this week $265,000, last week $268,000.
The majority of the homes closed this week used Conventional financing and half of them were at least 2000 square feet or more.
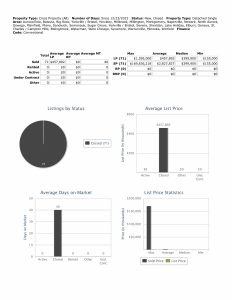
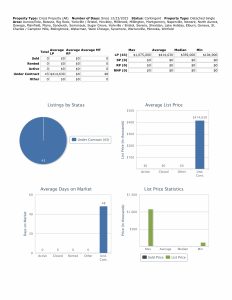
Under contract this week
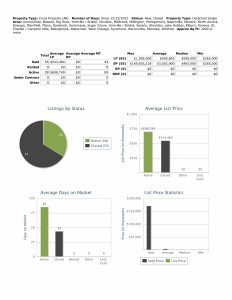
Homes that went under contract this week are way down. 43 this week compared to 97 the previous week.
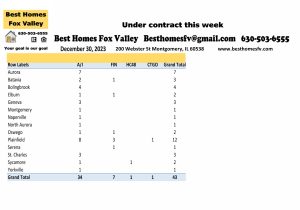
Plainfield-12
No short sales were accepted by seller’s this week.
A seller accepted a contract that is contingent on the buyer closing on their current home. 1 with a kick-out clause for 48 hours.
Median price for homes that went under contract this week $359,000 with 48 days average market time, last week $375,000 with 63 days average market time.
2023 and a look back at 2022, 2021, 2020, and 2019
2023 New Closed Under contract
January 483 326 470
February 630 526 789
March 555 558 726
April 710 617 755
May 735 603 816
June 1030 1059 926
July 765 745 805
August 869 988 915
September 684 621 623
October 639 568 549
November 601 720 610
December 249 497 363
Totals 7950 7828 8347
2022
January 422 492 623
February 523 520 724
March 734 904 890
April 1168 966 1334
May 1101 893 806
June 1295 1409 1234
July 955 932 908
August 1019 1134 1062
September 730 733 698
October 699 612 646
November 574 764 624
December 257 524 322
Totals 9477 9883 9871
2021
January 543 649 829
February 561 604 778
March 993 1099 1455
April 1006 926 1387
May 1088 1288 1289
June 1450 1686 1671
July 1118 1182 1210
August 1109 1203 1170
September 1083 1411 1251
October 715 973 930
November 557 854 931
December 349 1044 652
Totals 10572 12919 13533
2020
January 1105 566 858
February 1267 529 1024
March 1186 707 1079
April 648 786 775
May 1352 1010 1444
June 1232 908 1534
July 1417 1453 1852
August 1037 1335 1436
September 1176 1503 1503
October 843 1116 1159
November 567 985 699
December 513 971 783
Totals 12343 11869 14146
2019
January 878 407 568
February 1032 463 832
March 1731 915 1375
April 1594 792 1307
May 1645 995 1280
June 1643 1253 1218
July 1423 1008 1090
August 1585 1330 1196
September 1164 765 869
October 1041 738 776
November 897 946 839
December 496 638 497
Totals 15129 10250 11847
What a difference from 2019 to 2023. You can see the steady decline in listings. Supply and demand. You can see why listings have increased in price.
Contact us
Call us at 630-503-6555 with all your real estate questions. Your goal is our goal.
All data provided today is from our MLS, MRED, LLC. It changes throughout the day.
To get information about types of loans and the process, VA loans and the requirements, down payment resource, IHDA programs, request a home valuation, sign-up for email alerts and search for a home go here.
Fox Valley home prices December 30th. Happy New Year! Have an awesome week ahead.
Kristine Heiman, Designated Managing Broker
SFR, SRS, SRES, AHWD
Best Homes Fox Valley
200 Webster St
Montgomery, IL 60538
630-503-6555 Ext 101