Fox Valley home prices November 18th

Fox Valley home prices November 18th. 55 degrees today and tomorrow and then we head into the mid 40’s.
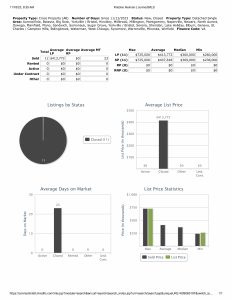
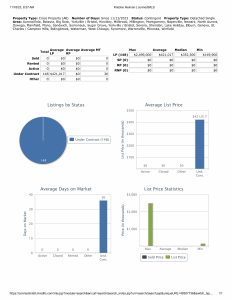
New listings this week are down. 132 this week compared to 155 the previous week.
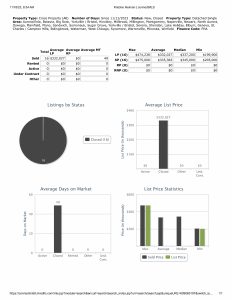
Closed listing are up. They are almost reversed from new listings. 156 this week compared to 134 the previous week.
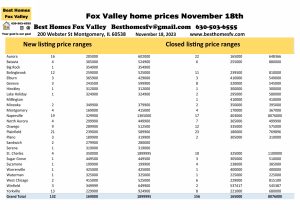
Aurora-New 16 $205,000-$602,000
Closed-22 $165,000-$648,366
Bolingbrook-New 12 $259,000-$525,000
Closed-11 $239,500-$810,000
Naperville-New 19 $329,900-$1,365,500
Closed-17 $403,000-$8,076,000
Oswego-New 9 $289,900-$512,500
Closed-12 $335,000-$575,000
Plainfield-New 21 $239,000-$589,900
Closed-23 $180,000-$769,896
St Charles-New 4 $350,000-$1,899,995
Closed-10 $325,000-$1,100,000
Yorkville-New 13 $229,900-$924,900
Closed-8 $221,000-$680,000
26 communities had activity this week. I just highlighted the ones with the most activity. Take a look at the photo above.
Financing used, median prices, and 2,000 SF or more
Median list price this week $400,000, last week $409,900.
Closed median price this week $425,000, last week $407,450.
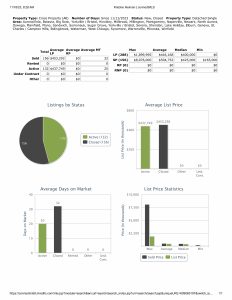
Conventional financing was used to close on 95 homes this week at median price $445,000 with 24 days average market time, last week 100 homes at median price $425,000 with 32 days average market time.
Cash was used to close on 30 homes at median price $489,000 with 47 days average market time, last week 16 homes at median price $405,995 with 17 days average market time.
FHA financing was used to close on 16 homes at median price $345,000 with 49 days average market time, last week 12 homes at median price $346,500 with 33 days average market time.
VA financing was used to close on 11 homes this week at median price $369,000 with 23 days average market time, last week 3 homes at median price $466,410 with 23 days average market time.
2,000 SF or more closed on 91 homes this week at median price $510,000 with 39 days average market time, last week 83 homes at median price $470,000 with 34 days average market time. Minimum price this week $300,000, last week $292,000
Conventional financing continues to be the way to go.
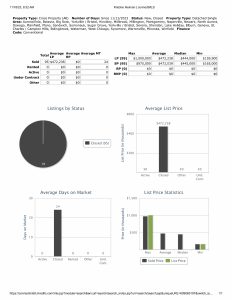
Under contract this week
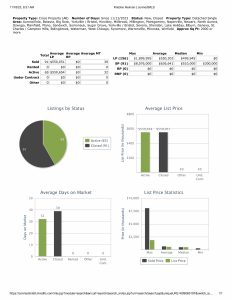
Homes under contract this week are up. 148 this week compared to 119 the previous week.
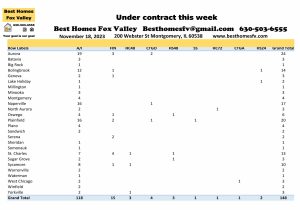
Aurora-24 Bolingbrook-14
Naperville-17 Plainfield-20
St Charles-13 Sycamore-10
1 short sale was accepted by a seller. It was in Plainfield.
Seller’s accepted contracts that are contingent on the buyer closing on their current home. 1 with a kick-out clause of 72 hours and 3 with 48 hours.
Also, seller’s accepted contracts that are contingent on the buyer selling and closing on their current home. 3 with a kick-out clause of 48 hours and 2 with 24 hours.
Median price of homes that went under contract this week $352,500 with 36 days average market time, last week median price $394,444 with 32 days average market time.
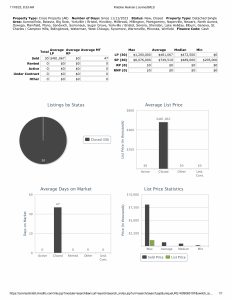
2023 by the month
Month New Closed Under contract
January 483 326 470
February 630 526 789
March 555 558 726
April 710 617 755
May 735 603 816
June 1030 1059 926
July 765 745 805
August 869 988 915
September 684 621 623
October 639 568 549
November 419 477 403
Totals 7519 7088 7777
Check back with us every Saturday for the real estate market update for the Fox Valley area of Illinois. At the end of each month we will also take a look back at 2022 and 2021.
You can see activity continues throughout the year. It might slow down in some months but it continues.
Contact us
Call us with all your real estate questions. Your goal is our goal.
Check out some great resources here.
Data provided today is from our MLS, MRED, LLC. It changes throughout the day.
Fox Valley home prices November 18th. Have an awesome week. Happy Thanksgiving!
Kristine Heiman, Designated Managing Broker
SFR, SRS, SRES, AHWD
Best Homes Fox Valley
200 Webster St
Montgomery, IL 60538
630-503-6555 Ext 101.