Fox Valley area of Illinois home prices January 3rd
Fox Valley area of Illinois home prices January 3rd. It is 26 degrees and cloudy right now. This next week we should see highs from 28-47 degrees and lows from 15-39 degrees.
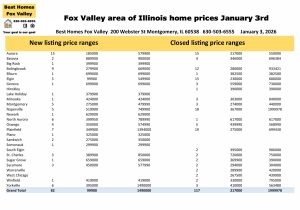
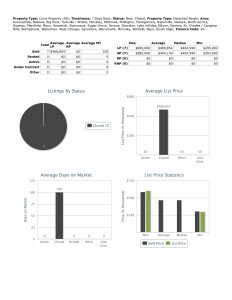
New listing this week are up. 82 this week compared to 39 the previous week.
Closed listing are also up. 117 this week compared to 99 the previous week.
Aurora New-15 $185,000-$579,900
Closed-15 $217,000-$550,000
Bolingbrook New-9 $279,900-$669,000
Closed-12 $280,000-$933,421
Elgin New-5 $99,900-$549,900
Closed-15 $230,000-$680,000
Naperville New-5 $519,900-$749,900
Closed-18 $367,000-$1,999,978
Plainfield New-7 $349,900-$1,394,000
Closed-19 $275,000-$699,430
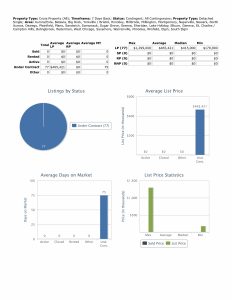
Look at photo above to see other communities with activity this week and their price ranges. Maybe one of them have the price range you are looking for.
Financing used, median price, and 2,000 SF or more
Median list price this week $439,990, last week $414,995.
Closed median price this week $440,000, last week $415,000.

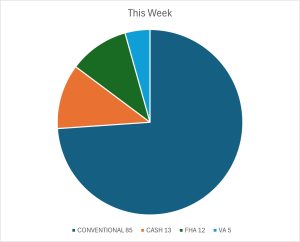
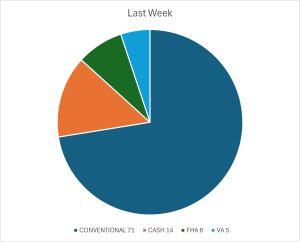
Conventional financing was used to close on 85 homes this week at median price $440,000 with 49 days average market time, last week 71 homes at median price $449,000 with 36 days average market time.
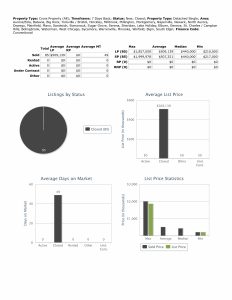
Cash was used to close on 13 homes this week at median price $555,000 with 27 days average market time, last week 14 homes at median price $377,500 with 40 days average market time.
FHA financing was used to close on 12 homes this week at median price $363,700 with 78 days average market time, last week 8 homes at median price $304,500 with 24 days average market time.
VA financing was used to close on 7 homes this week at median price $464,990 with 100 days average market time, last week 5 homes at median price $423,345 with 85 days average market time.
2,000 SF or more closed on 63 homes at median price $550,000 with 67 days average market time, last week 51 homes at median price $525,000 with 45 days average market time. Minimum price this week $305,000, last week $299,900.
Over 72% of homes closed this week used conventional financing and over 53% were at least 2,000 SF or more.
Every week the inventory of homes are different.
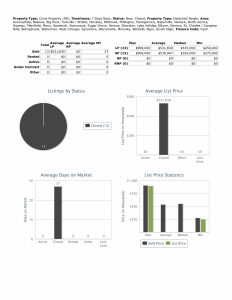
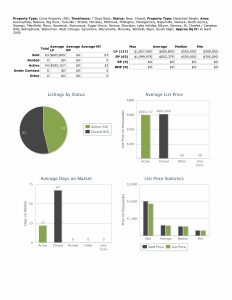
Under contract this week
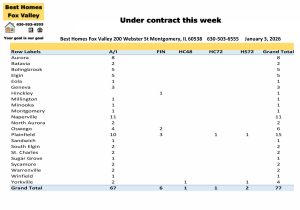
Homes that went under contract are consistent. 77 homes this week compared to 74 the previous week.
Naperville-11 Plainfield-15
Other communities also had homes that went under contract. Look at the photo above.
No short sales were accepted by seller’s this week.
Seller’s accepted contracts that are contingent on the buyer closing on their current home. 1 with a kick-out clause of 72 hours and 1 with 48 hours.
Also, seller’s accepted contracts that are contingent on the buyer selling and closing on their current home. 2 with a kick-out clause of 72 hours.
Median price of home that went under contract this week $415,000 with 75 days average market time, last week $460,125 with 61 days average market time.
2025 by the month and a look back at 2024 and 2023
2025
Month New Closed Under contract
January 585 590 652
February 609 504 590
March 785 569 746
April 856 661 818
Mary 1282 961 1115
June 1098 871 948
July 1278 1169 1063
August 935 858 843
September 1012 698 785
October 1040 981 991
November 568 678 641
December 439 699 480
Totals 10,487 9,239 9,672
2024
January 576 523 599
February 637 416 691
March 674 612 792
April 800 688 801
May 1077 1002 1075
June 1009 906 918
July 1173 1050 1094
August 883 858 725
September 849 734 777
October 990 936 878
November 587 659 601
December 345 600 541
Totals 9,600 8,984 9,492
2023
January 483 326 470
February 630 526 789
March 555 558 726
April 710 617 755
May 735 603 816
June 1030 1059 926
July 765 745 805
August 869 988 915
September 684 621 623
October 639 568 549
November 601 720 610
December 249 497 363
Totals 7,950 7,828 8,347
A little progress all 3 years in totals.
I wanted to wait until this week to end the year because there was a couple of days of December and then a couple of days that were a holiday.
I hope this year the trend in progress continues.
Check back with us every Saturday for the real estate market update for the Fox Valley area of Illinois.
Contact us
Call us at 630-503-6555 with all your real estate questions. Your goal is our goal.
Buyer’s and seller’s can get information about the process by going here nar.realtor/the-facts. Click on I am a homebuyer or seller and scroll down to see the guides and videos. If you still have questions please let us know.
You can also go to request a home valuation, sign-up for email alerts, down payment assistance, IHDA programs, and search for a home.
All data provided today was downloaded from our MLS, MRED, LLC. It changes throughout the day as agents upload their information.
Fox Valley area of Illinois home prices January 3rd. Happy New Year! Have an awesome week.
Kristine Heiman, Managing Broker
ABR, MRP, AHWD, SFR, SRS, SRES
200 Webster St
Montgomery, IL 60538
630-503-6555 Ext 101