Fox Valley area of Illinois home prices October 18th
Fox Valley area of Illinois home prices October 18th. It is 72 degrees and cloudy right now. Next week we should see highs from 53-74 degrees and lows from 35-48 degrees.
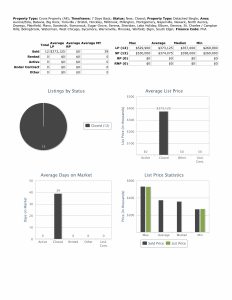
New listings are down. 198 this week compared to 237 the previous week.
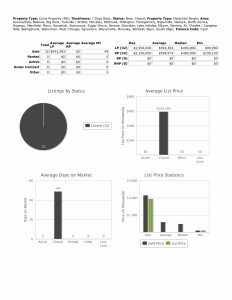
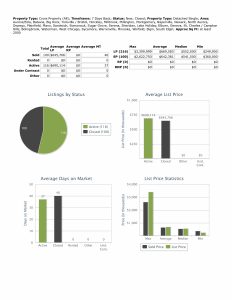
Closed listings are up. 170 this week compared to 151 the previous week.
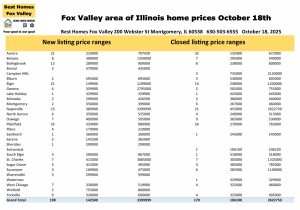
Here are the communities with the most activity this week and their price ranges.
Aurora New- 21 $210,000-$707,428
Closed-32 $135,000-$672,000
Bolingbrook New-13 $289,900-$909,000
Closed-8 $238,000-$600,000
Elgin New-21 $149,900-$1,199,000
Closed-14 $248,000-$1,200,000
Naperville New-23 $389,900-$3,399,999
Closed-21 $455,000-$2,622,750
Plainfield New-35 $324,900-$989,900
Closed-26 $270,000-$765,000
You can see other communities that also had activity and their price ranges in the photo above.
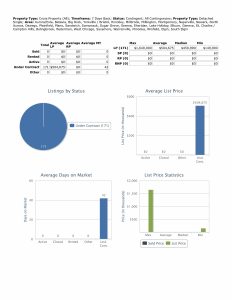
Financing used, median price, and 2,000 SF or more
Median list price this week $469,900, last week $450,000
Closed median price this week $453,700, last week $442,000
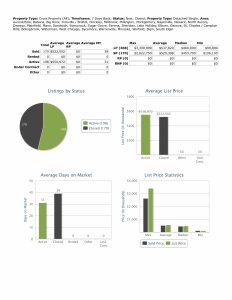
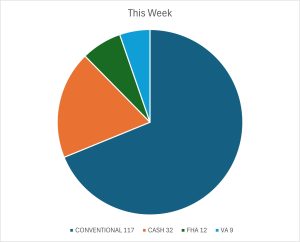
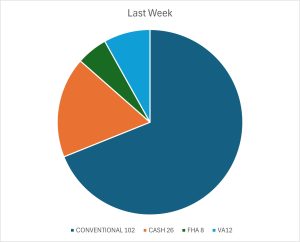
Conventional financing was used to close on 117 homes this week at median price $465,000 with 35 days average market time, last week 102 homes at median price $436,000 with 34 days average market time.
Cash was used to close on 32 homes this week at median price $480,000 with 49 days average market time, last week 26 homes at median price $520,000 with 22 days average market time.
FHA financing was used to close on 12 homes this week at median price $358,000 with 39 days average market time, last week 8 homes at median price $332,500 with 17 days average market time.
VA financing was used to close on 9 homes this week at median price $420,000 with 45 days average market time, last week 12 homes at median price $437,500 with 45 days average market time.
2,000 SF or more closed on 100 homes this week at median price $541,500 with 40 days average market time, last week 90 homes at median price $571,500 with 38 days average market time. Minimum price this week $360,000, last week $250,000.
Over 68% of homes closed this week used conventional financing and over 58% of homes closed were at least 2,000 SF or more.
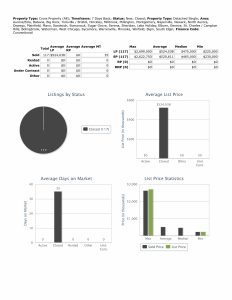
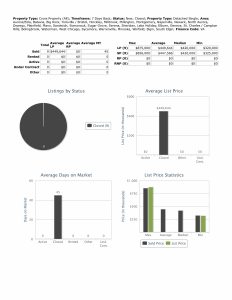
Under contract this week
Under contract listings are down. 171 this week compared to 217 the previous week.
Aurora-18 Bolingbrook-12
Elgin-22 Naperville-31
Plainfield-23
No short sales were accepted by seller’s this week.
Seller’s accepted contracts that are contingent on the buyer closing on their current home. 2 with a kick-out clause of 72 hours.
Also, seller’s accepted contracts that are contingent on the buyer selling and closing on their current home. 2 with a kick-out clause of 72 hours and 1 with 24 hours.
That is only 5 out of 171 homes that received contracts that were contingent on a home close or sell & close.
Median price of homes that went under contract this week $459,990 with 42 days average market time, last week $445,000 with 43 days average market time.
2025 by the month
Month New Closed Under contract
January 585 590 652
February 609 504 590
March 785 569 746
April 856 661 818
May 1282 961 1115
June 1098 871 948
July 1278 1169 1063
August 935 858 843
September 1012 698 785
October 640 562 625
Totals 9080 7443 8185
Check back with us every Saturday for the real estate market update for the Fox Valley area of Illinois.
At the end of each month we will also take a look back at 2024 and 2023.
Contact us
Call us at 630-503-6555 with all of your real estate questions. Your goal is our goal.
For information about buying and selling a home a good place to go is nar.realtor/the-facts and scroll down to see the guides and videos there.
It also explains the buyers brokerage fee that is in place now since last August 17th.
You can also go to request a home valuation, down payment assistance, sign-up for email alerts, IHDA assistance, andsearch for a home.
All data downloaded today is from our MLS, MRED, LLC. It changes throughout the day.
Fox Valley area of Illinois home prices October 18th. Have an awesome week!
Kristine Heiman, Managing Broker
ABR, SFR, AHWD SRS, SRES, MRP
200 Webster St
Montgomery, IL 60538
630-503-6555 Ext 101