Fox Valley area of Illinois home prices August 23rd
Fox Valley area of Illinois home prices August 23rd. It is sunny and 80 degrees right now. This next week we should see highs between 69-82 degrees and lows between 48-59.
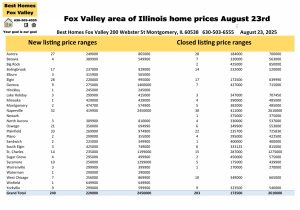
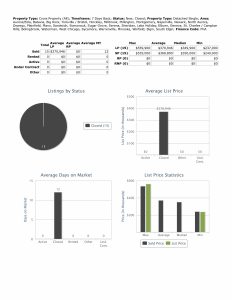
New listing this week are consistent. 240 this week compared to 22 the previous week.
Closing listing are very consistent. 203 this week compared to 201 the previous week.
Aurora New-27 $249,000-$865,000
Closed-28 $184,000-$700,000
Bolingbrook New-17 $237,000-$929,000
Closed-14 $232,000-$520,000
Elgin New-28 $220,000-$995,000
Closed-17 $172,500-$639,990
Naperville New-32 $419,900-$2,450,000
Closed-30 $411,000-$2,610,000
Oswego New-21 $350,000-$694,990
Closed-6 $349,900-$553,000
Plainfield New-33 $269,900-$974,900
Closed-22 $235,700-$725,830
St Charles New-14 $235,000-$1,199,000
Closed-15 $287,000-$1,275,000
Sycamore New-10 $250,000-$1,299,000
Closed-5 $175,000-$439,900
West Chicago New-7 $256,000-$869,900
Closed-10 $349,000-$665,000
Check the photo above to see other communities that also had activity this week and their price ranges.
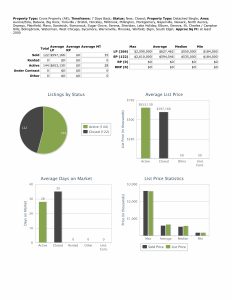
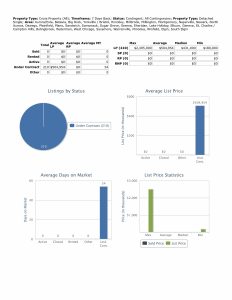
Financing used, median prices, and 2,000 SF or more
Median list price this week $460,000, last week $464,990.
Closed median price this week $450,000, last week $460,000.
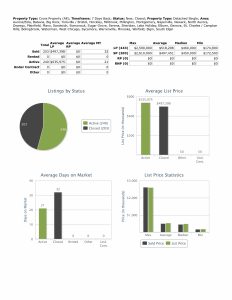
Conventional financing was used to close on 139 homes this week at median price $475,000 with 33 days average market time, last week 136 homes at median price $475,143 with 29 average market time.
Cash was used to close on 39 homes at median price $385,000 with 42 days average market time, last week 34 homes at median price $399,500 with 27 days average market time.
FHA financing was used to close on 15 homes at median price $350,000 with 12 days average market time, last week 20 homes at median price $371,000 with 33 days average market time.
VA financing was used to close on 9 homes at median price $490,000 with 12 days average market time, last week 10 homes at median price $550,000 with 17 days average market time.

2,000 SF or more closed on 122 homes at median price $535,000 with 35 days average market time, last week 123 homes at median price $550,000 with 33 days average market time. Minimum price this week $184,000, last week $227,000.
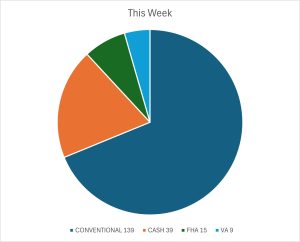
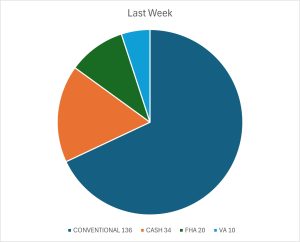
You can see Conventional financing and cash continue to be the biggest pieces of the pie.
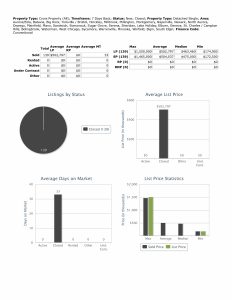
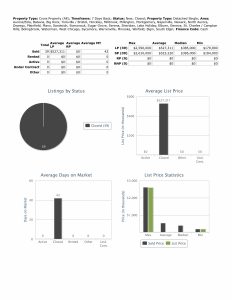
Under contract this week
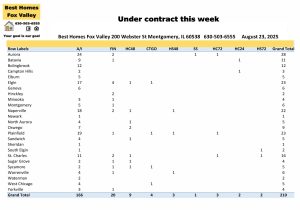
Homes that went under contract this week are consistent. 210 this week compared to 215 the previous week.
Aurora-28 Batavia-11
Bolingbrook-12 Elgin-23
Naperville22 Plainfield-23
St Charles-16
There was 1 short sale accepted by a seller this week. It was in Aurora.
Seller’s accepted contracts that are contingent on the buyer closing on their current home. 3 with a kick-out clause of 72 hours, and 9 with 48 hours, and 2 with 24 hours.
Also, seller’s accepted contracts that are contingent on the buyer selling and closing on their current home. 2 with a kick-out clause of 72 hours and 3 with 48 hours.
Under contract median price this week $431,000 with 54 days average market time, last week $439,900 with 40 days average market time.
2025 by the month
Month New Closed Under contract
January 585 590 652
February 609 504 590
March 785 569 746
April 856 661 818
May 1282 961 1115
June 1098 871 948
July 1278 1169 1063
August 717 626 640
Totals 7210 5951 6572
Check back with us every Saturday for the real estate market update for the Fox Valley area of Illinois. At the end of each month we will also take a look back at 2024 and 2023 so you have something to compare to.
Contact us
Call us at 630-503-6555 with all your real estate questions. Your goal is our goal.
If you are a buyer or seller looking for information about the process please go to nar.realtor/the-facts and scroll down to the guides and videos.
You can also request a home valuation, sign-up for email alerts, down payment assistance, and search for a home.
All data provided today was downloaded from our MLS, MRED, LLC. It changes throughout the day.
Fox Valley area of Illinois home prices August 23rd. Have an awesome week!
Kristine Heiman, Managing Broker
ABR, AHWD, MRP, SRS, SRES, SFR
200 Webster St
Montgomery, IL 60538
630-503-6555 Ext 101