Fox Valley home prices June 10th
Fox Valley home prices June 10th. Weather continues to be in the 70 and 80’s getting down to the upper 50’s at night. Perfect if only we had some rain.
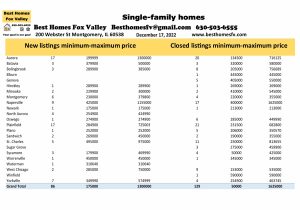
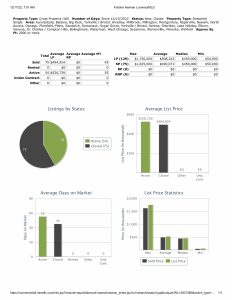
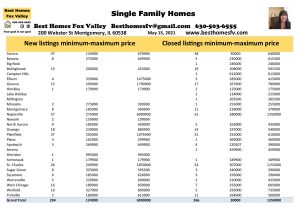
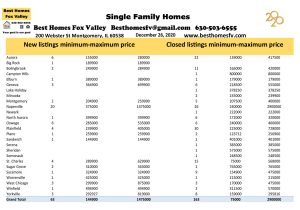
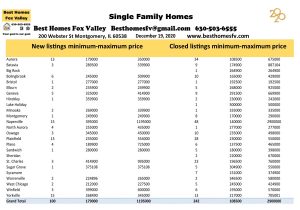
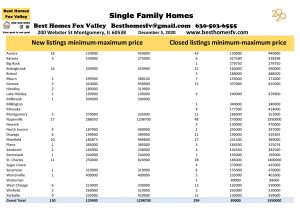
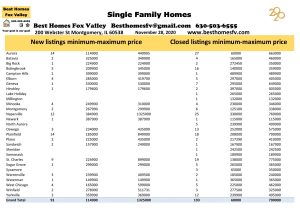
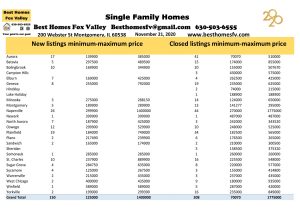
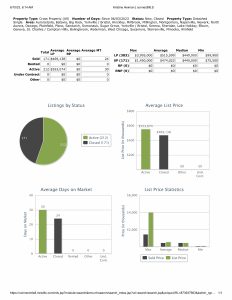
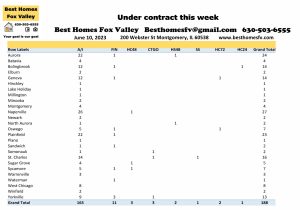
New listings this week are down. 212 this week compared to 231 the previous week.
Closed listings are also down. 171 this week compared to 237 the previous week.
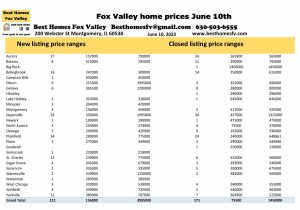
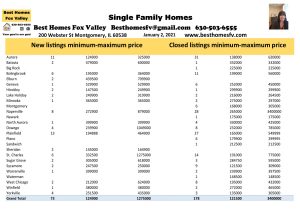
Aurora-New 27 $157,000-$790,000
Closed-24 $165,900-$565,000
Batavia-New 8 $415,000-$795,000
Closed-11 $290,000-$795,000
Bolingbrook-New 16 $247,000-$589,000
Closed-14 $250,000-$615,000
Naperville-New 54 $350,000-$1,995,000
Closed-34 $427,000-$1,325,000
Plainfield-New 34 $289,000-$775,000
Closed-24 $240,000-$648,861
St Charles-New 13 $239,900-$775,000
Closed-6 $325,000-$560,000
Yorkville-New 12 $389,900-$707,000
Closed-7 $364,900-$525,000
Other communities had activity this week. Click on the photo above to see the price ranges in those communities. We just highlight the most active. If you would like me to email you a copy let me know at besthomesfv@gmail.com.
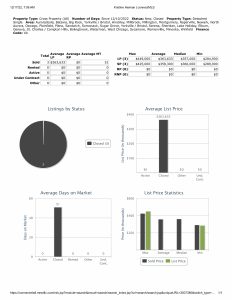
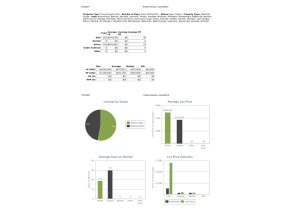
Financing used, median prices, and 2,000 SF or more
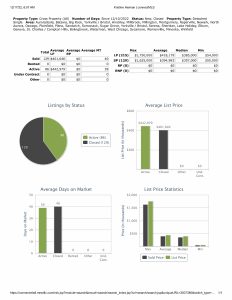
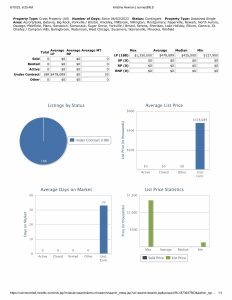
Median list price this week $449,900, last week $420,000
Closed median price this week $445,000, last week $420,100.
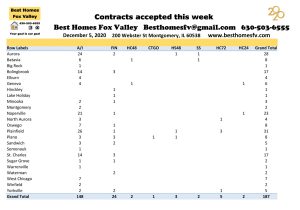
Conventional financing was used to close on 132 homes this week at median price $452,500 with 22 days average market time, last week 168 homes at median price $437,500 with 22 days average market time.
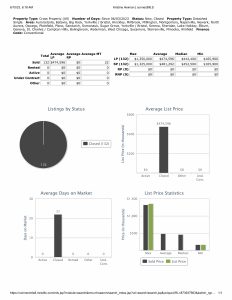
Cash was used to close on 26 homes this week at median price $448,500 with 34 days average market time, last week 33 homes at median price $425,000 with 20 days average market time.
FHA financing used to close on 6 homes this week at median price $349,990 with 7 days average market time, last week 20 homes at median price $337,750 with 43 days average market time.

VA financing was used to close on 6 homes this week at median price $416,225 with 25 days average market time, last week 14 homes at median price $412,500 with 15 days average market time.

2,000 Square feet or more closed on 105 homes at median price $523,000 with 24 days average market time, last week 142 homes at median price $510,000 with 26 days average market time. Minimum price this week $247,500, last week $255,000.
77% of homes closed this week using Conventional financing. The trend continues in our area.
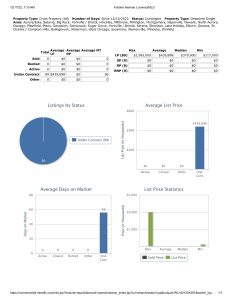
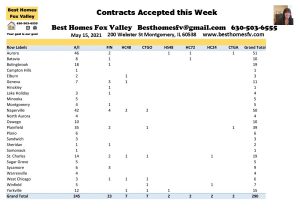
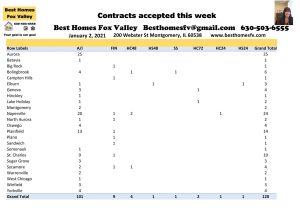
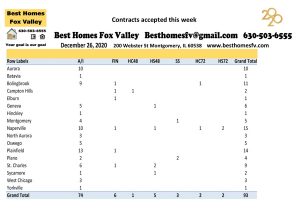
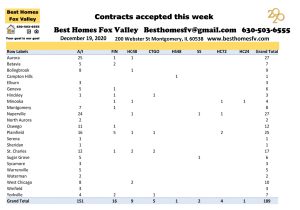
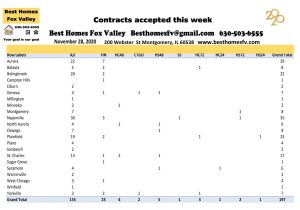
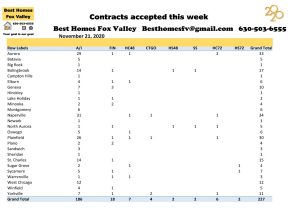
Under contract this week
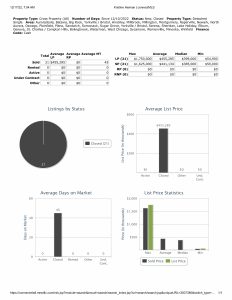
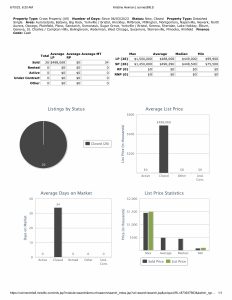
Homes that went under contract this week are up. 188 this week compared to 156 the previous week.
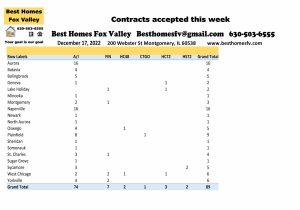
Aurora-24 Bolingbrook-14
Geneva-14 Naperville-27
Plainfield-23 St Charles-16
Yorkville-13
1 short sale was accepted by a seller this week. It was in St Charles. Now it will be submitted to the lender to see if they will also accept.
Seller’s accepted contracts that are contingent on the buyer closing on their current home. 2 with a kick-out clause of 72 hours, 3 with 48 hours, and 1 with 24 hours.
Also, seller’s accepted contracts that are contingent on the buyer selling and closing on their current home. 2 with a kick-out clause of 48 hours.
Homes under contract this week had a median price $425,000 with 33 days average market time, last week $430,000 with 31 days average market time.
2023 by the month
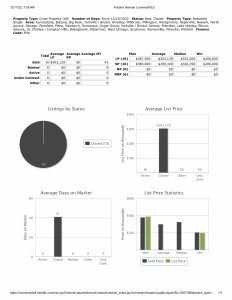
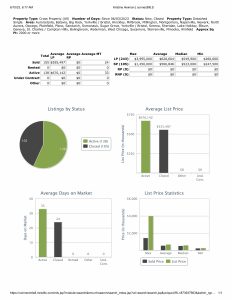
Month New Closed Under contract
January 483 326 470
February 630 526 789
March 555 558 726
April 710 617 755
May 735 603 816
June 443 408 344
Totals 3556 3038 3900
Check back with us every Saturday for the real estate market update in the Fox Valley area of Illinois. At the end of each month we will also take a look back at 2022, and 2021 so you have something to compare too.
New listings are more than closed listings, that is a good thing to see. We still need more listings in different price ranges so everyone has something to choose from.
Under contract listings sometimes come back on the market. That is why they are higher than closed listings.
Resources
Click on everything that is underlined and bold in the bullet points to take you to the site for the information.
- Types of loans and the process
- VA loans and the requirements
- Down payment assistance
- IHDA programs(help with down payment or closing costs)
- Request home valuation
- Sign-up for email alerts for new listings
- Search for homes anytime
Also check with your loan officer to see if they have any programs to help get you into a home.
All data provided today is from our MLS, MRED, LLC. It changes throughout the day.
Contact us
Call us at 630-503-6555 with all your real estate questions. Your goal is our goal.
Fox Valley home prices June 10th. Have an awesome week!
Kristine Heiman, Designated Managing Broker
SFR, SRS, SRES, AHWD
200 Webster St
Montgomery, IL 60538
630-503-6555 Ext 101