Fox Valley home prices November 5th

Fox Valley home prices November 5th. It is the first week in November and the weather is still mild. We will show you the home prices in the most active communities in the Fox Valley area of Illinois. The financing most used to close a home, median prices, and 2022 by the month.
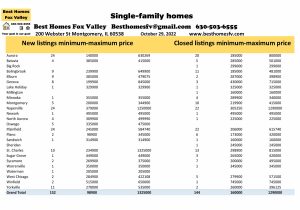
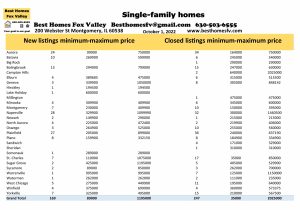
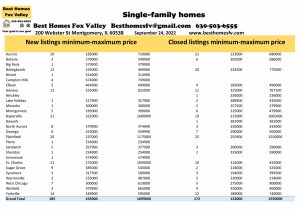
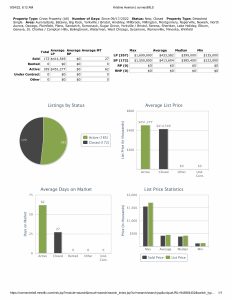
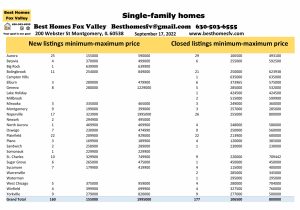
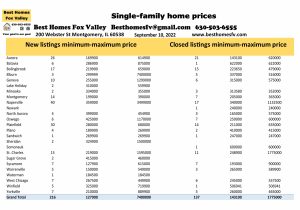
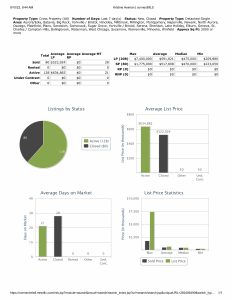
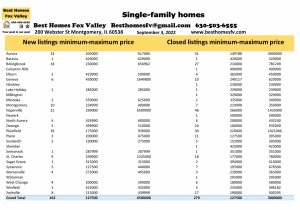
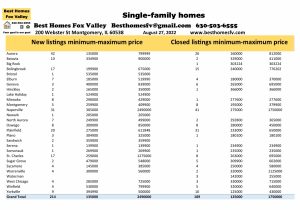
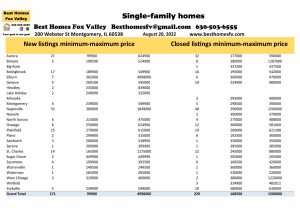
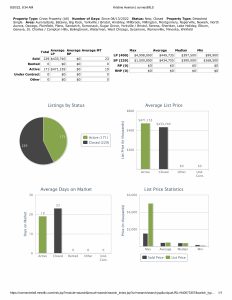
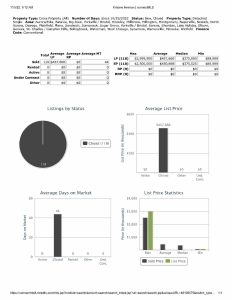
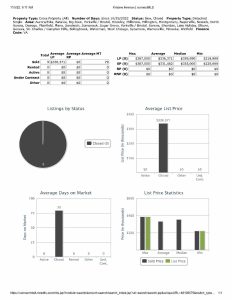
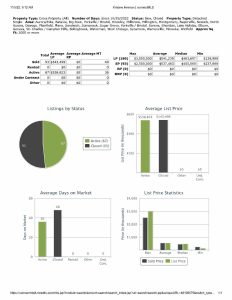
New listings this week were down. 141 this week compared to 152 the week previously.
Closed listings were up. 182 this week compared to 144 the week previously.
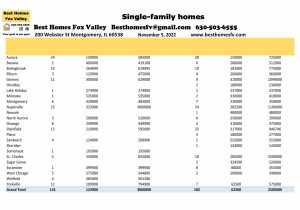
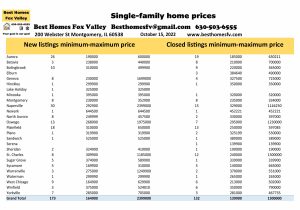
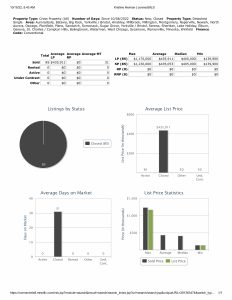
Aurora-New 24 $159,900-$585,000
Closed-28 $150,000-$725,000
Bolingbrook-New 10 $264,999-$619,995
Closed-19 $181,000-$775,000
Geneva-New 11 $300,000-$629,000
Closed-9 $310,000-$1,049,000
Naperville-New 25 $323,900-$3,000,000
Closed-24 $282,500-$1,196,000
Plainfield-New 15 $219,900-$595,000
Closed-25 $217,000-$946,746
St Charles-New $250,000-$825,000
Closed-18 $285,000-$2,500,000
Yorkville-New 12 $199,900-$794,900
Closed-7 $62,500-$575,000
More communities had activity this week. Click on the photo above to see.
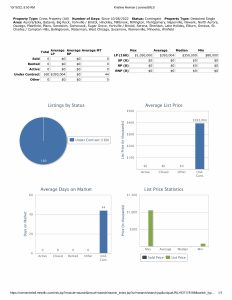
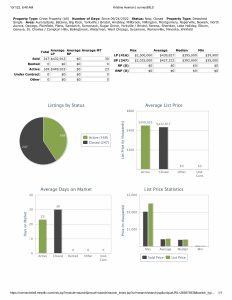
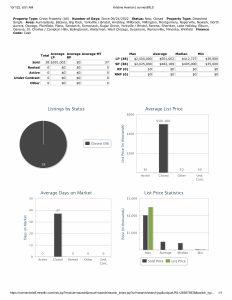
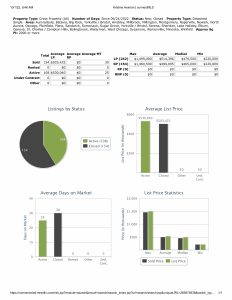
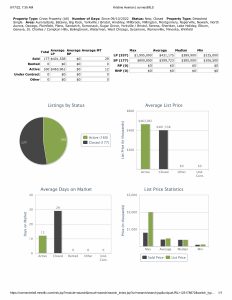
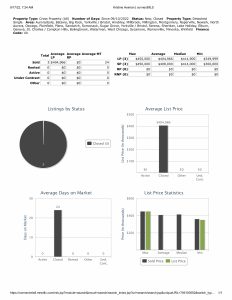
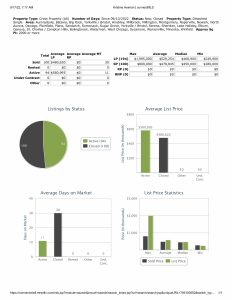
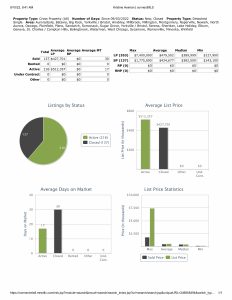
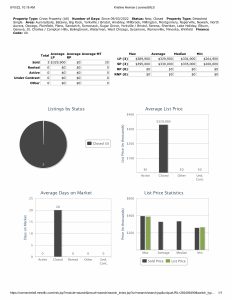
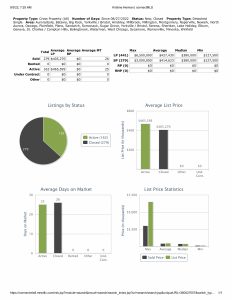
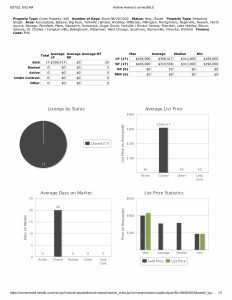
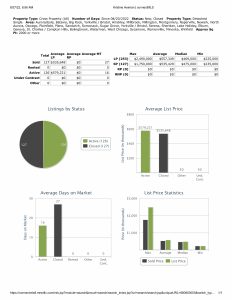
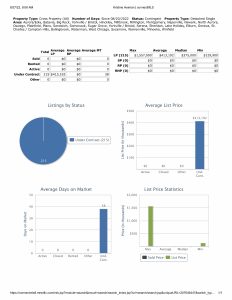
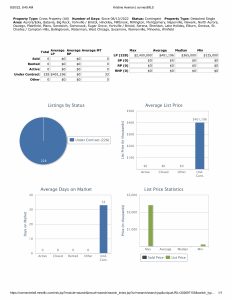
Financing used, median prices, and 2,000 SF or more
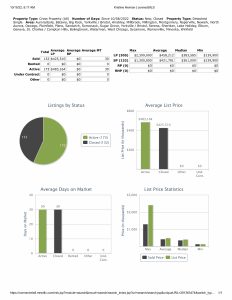
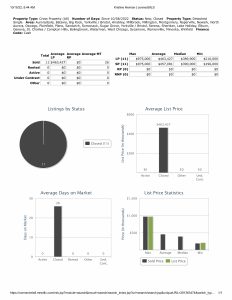
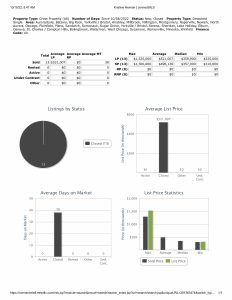
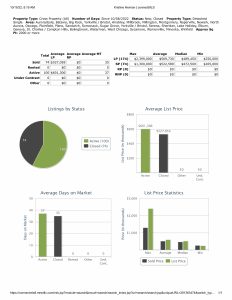
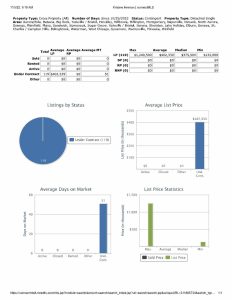
Median list price this week $369,900, last week $389,999
Closed median price this week $355,000, last week $375,000.
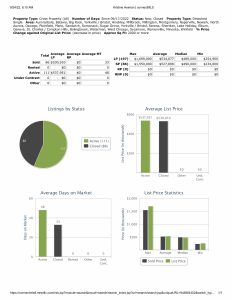
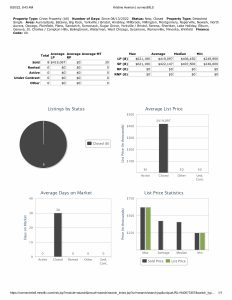
Conventional financing was used to close on 118 homes at median price $375,525 with 44 days average market time, last week 89 homes at median list price $400,000 with 37 days average market time.
Cash was used to close on 29 homes at median price $353,000 with 37 days average market time, last week 24 homes at median price $390,00 with 24 days average market time.
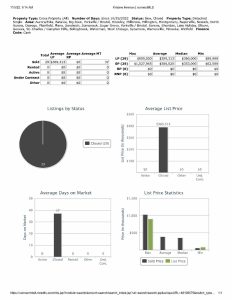
FHA financing was used to close on 24 homes at median price $310,000 with 40 days average market time, last week 19 homes at median price $298,900 with 38 days average market time.

VA financing was used to close on 9 homes at median price $355,000 with 79 days average market time, last week 9 homes at median price $375,000 with 15 days average market time.
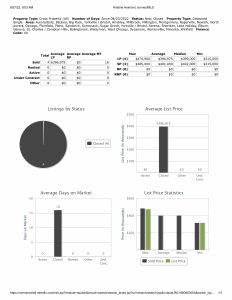
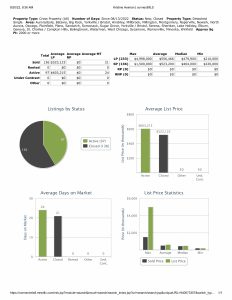
2,000 SF or more closed on 93 homes at median price $455,000 with 48 days average market time, last week 88 homes at median price $464,994 with 35 days average market time. Minimum price this week $237,000, last week $200,000.
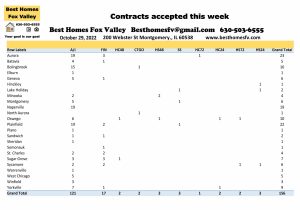
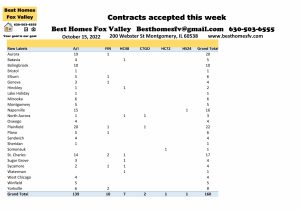
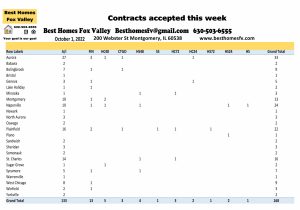
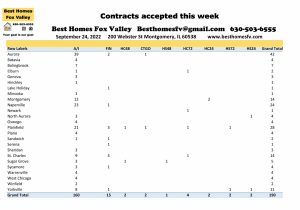
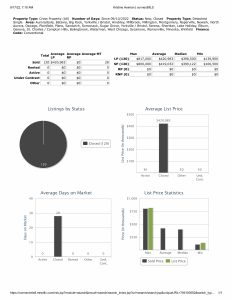
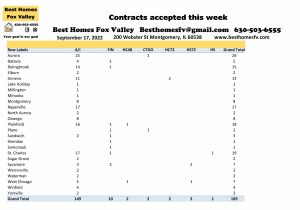
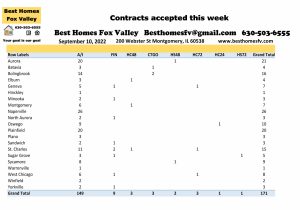
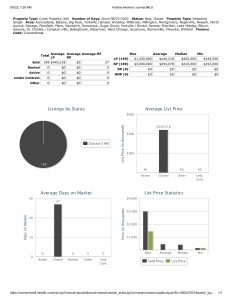
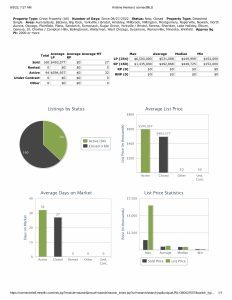
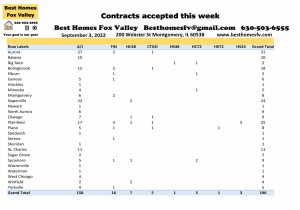
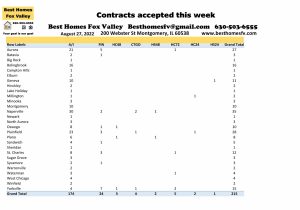
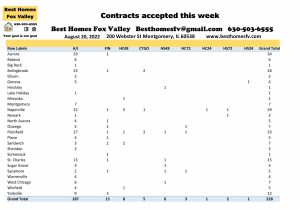
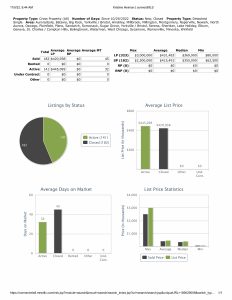
Contracts accepted this week
Contracts accepted by seller’s this week are down. 119 this week compared to 156 the previous week.
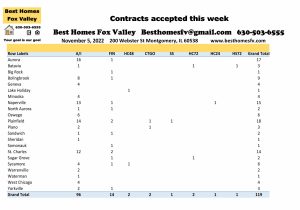
Aurora-17 Naperville-15
Plainfield-18 St Charles-14
1 short sale was accepted by a seller. It was in Plainfield. Now it will be submitted to the lender to see if they will also accept.
Seller’s accepted contracts that are contingent on the buyer closing on their current home. 2 with a kick-out clause of 72 hours, 2 with 48 hours, and 1 with 24 hours.
Also, a seller accepted a contract that is contingent on the buyer selling and closing on their current home. 1 with a kick-out clause of 72 hours.
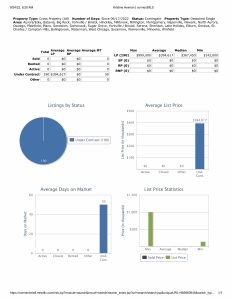
Medium price of homes that went under contract this week $379,900 with 51 days average market time, last week $369,450 with 45 days average market time.
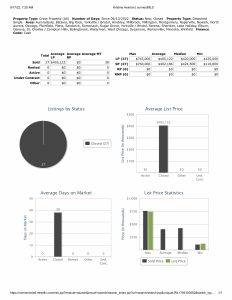
2022 by the month
Month New Closed Contracts accepted
January 422 492 623
February 523 520 724
March 734 904 890
April 1168 966 1334
May 1101 893 806
June 1295 1409 1234
July 955 932 908
August 1019 1134 1062
September 730 733 698
October 699 612 646
November 141 182 119
Totals 8787 8777 9044
Check back with us every Saturday for the real estate market update. At the end of each month we will look back at 2021 and 2020 so you have something to compare to.
Resources
Click on everything that is bold and underlined to take you to the site for the information. If there is other information you are looking for let us know and we will point you in the right direction.
- Types of loans and the process
- VA loans and the requirements
- Current interest rates
- Down payment assistance
- IHDA programs
- Request home valuation
- Sign-up for email alerts
- Search for homes
Check with your loan officer to see what interest rate you will be offered. It depends on your credit score and some other things. They can explain it to you.
Look for us on Facebook and give us a “like.” If you click on the button “shop now” you can search for homes. There is a down arrow so you can search different criteria.
All data provided is from our MLS, MRED, LLC. The data changes continuously throughout the day as agents upload their information.
Contact us
Call us at 630-503-6555 with all your real estate questions. Your goal is our goal.
Fox Valley home prices November 5th. have an awesome week!
Kristine Heiman, SFR, SRS, SRES, AHWD
Designated Managing Broker
Best Homes Fox Valley
200 Webster St
Montgomery, IL 60538
630-503-6555 Ext 101